Geospatial Analytics: What Is It & How Can It Give You a Competitive Edge?

Geospatial analytics is a massive and growing market. It’s estimated that the global geospatial analytics market grew to $78.5 billion in 2023 and could top $141.9 billion by 2028 at an annual growth rate of 12.6%. This blog post will teach you the basics of geospatial analytics, specifically for property analysis and its uses across business settings. You’ll learn what this field entails and how companies can use it to achieve numerous objectives.
So what is geospatial analytics?
Geospatial analytics is a form of computational analysis that leverages geographic information, spatial data, location data, and increasingly, high-resolution imagery, computer vision, and other forms of AI to extract structured data that can be used for specific applications and industries.
Want to jump ahead? Here’s what we’ll explore in this post:
The Origins of Geospatial Analytics
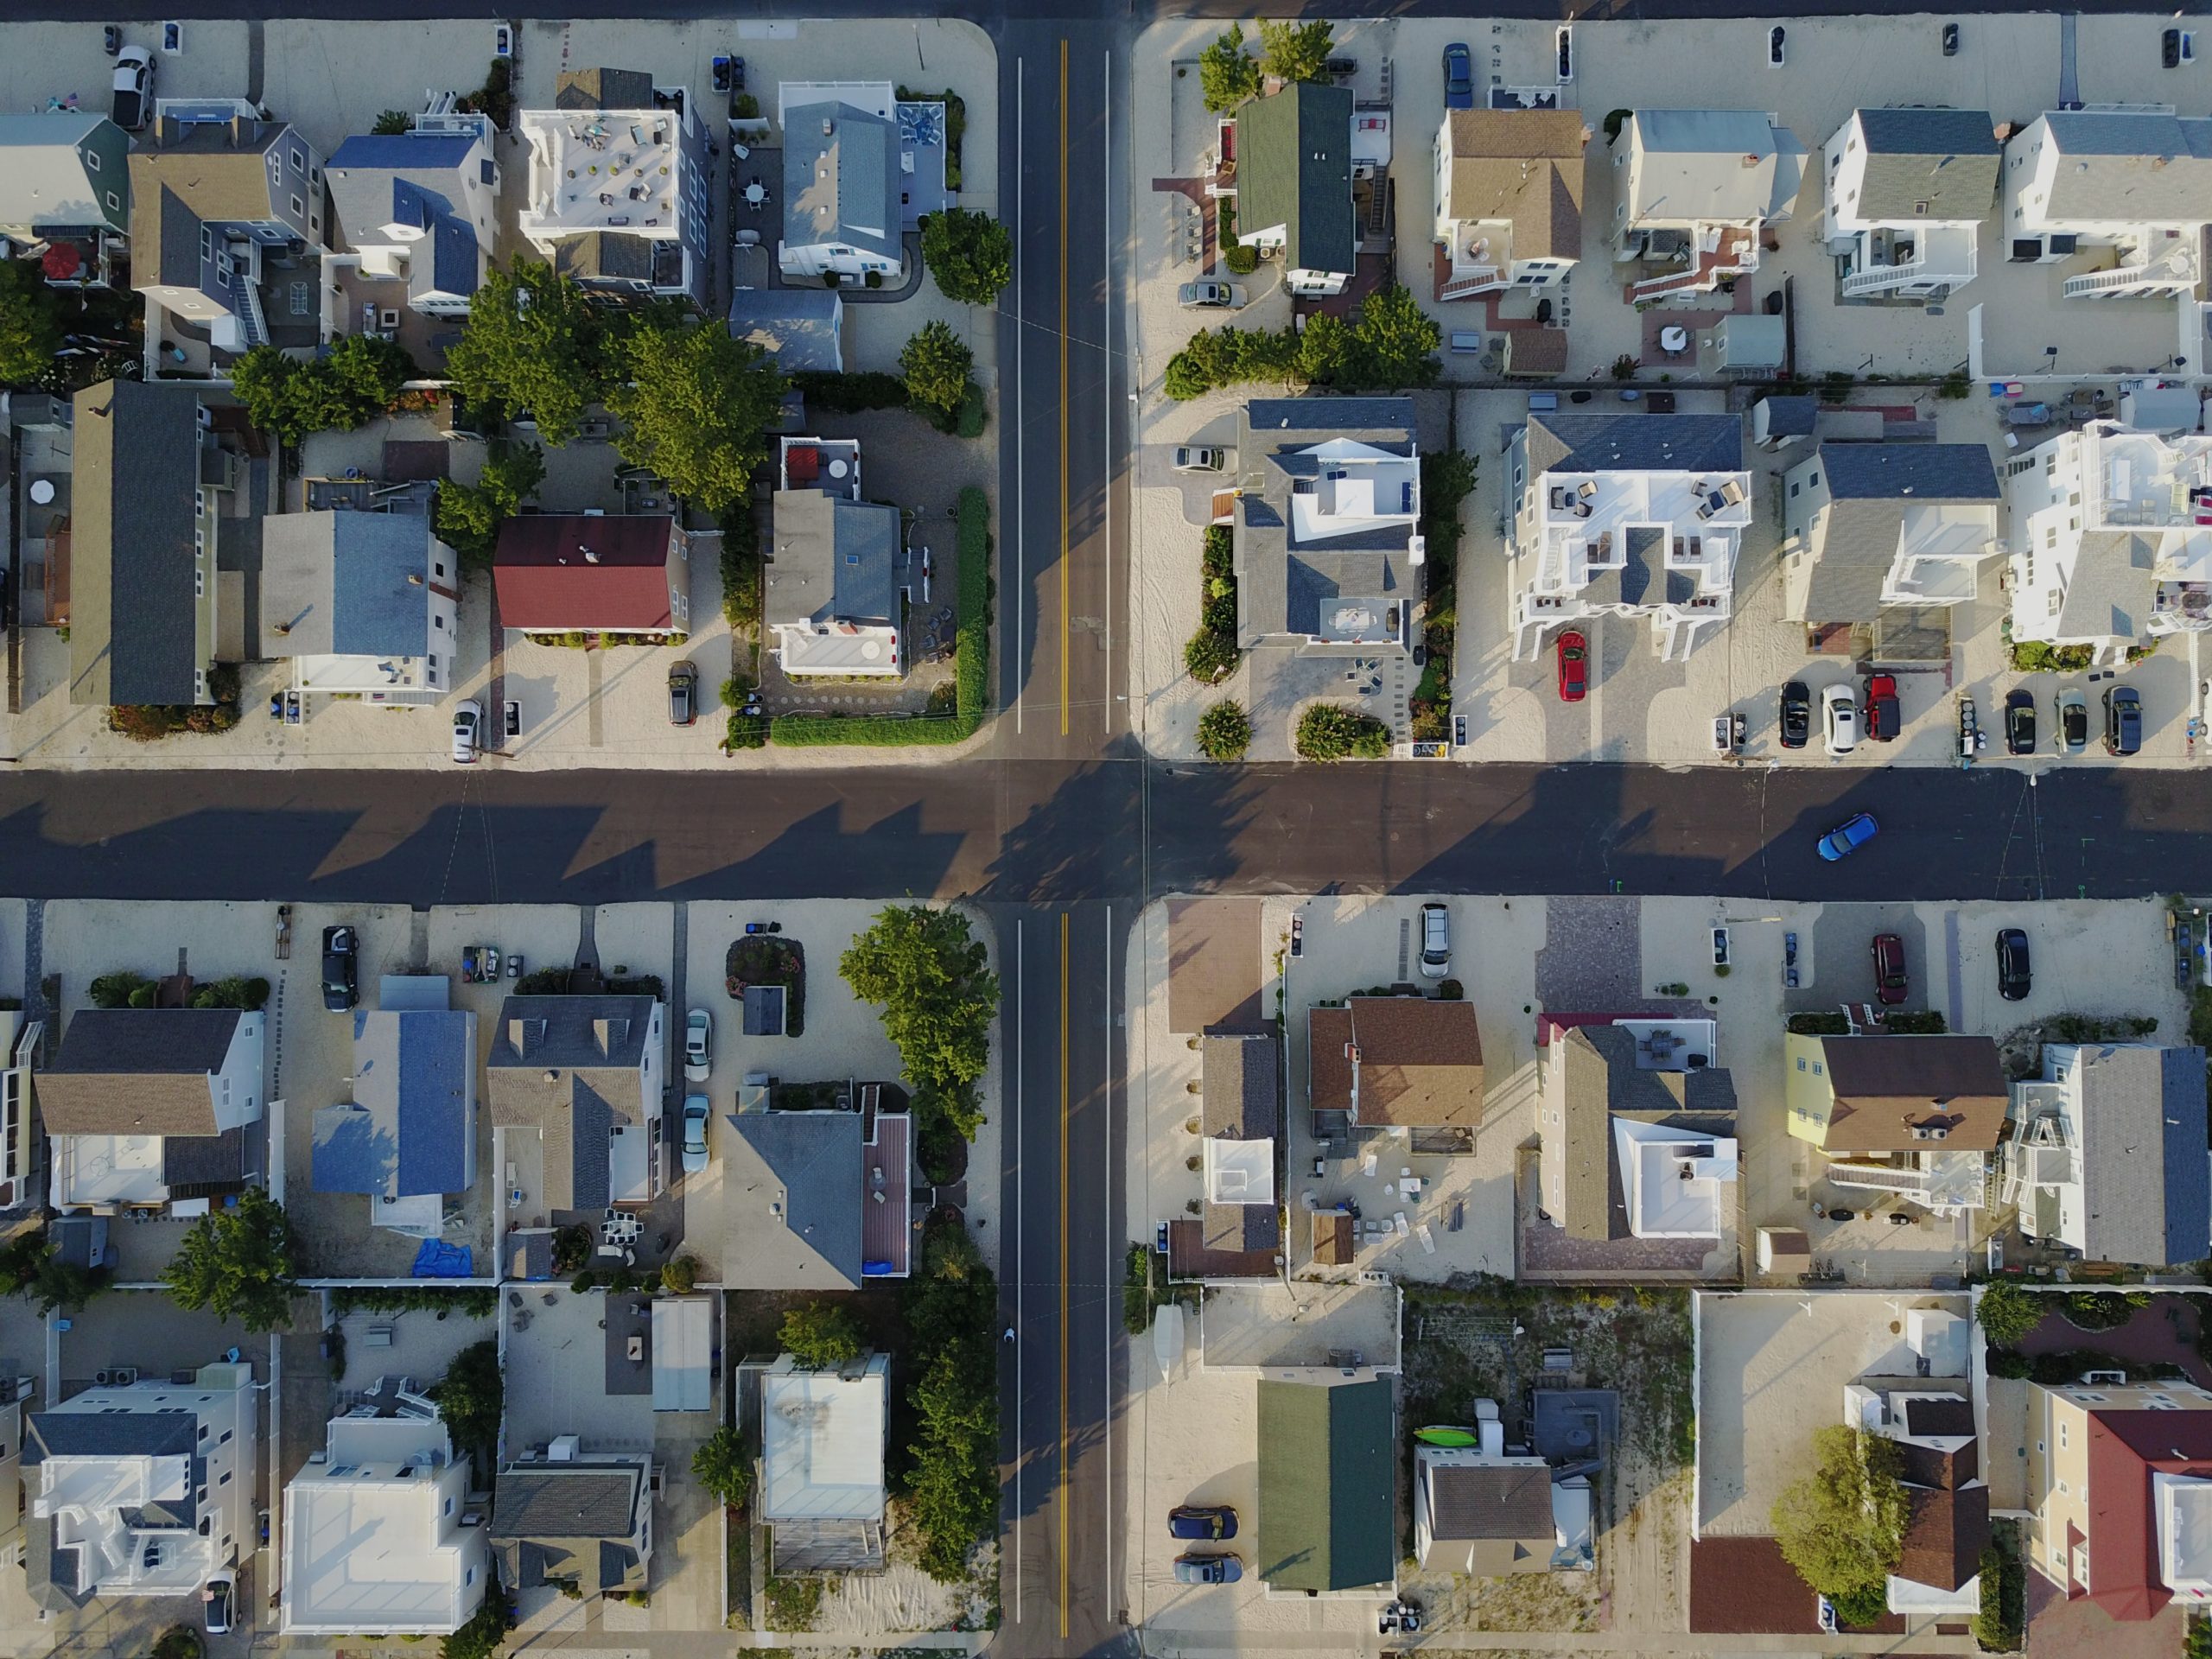
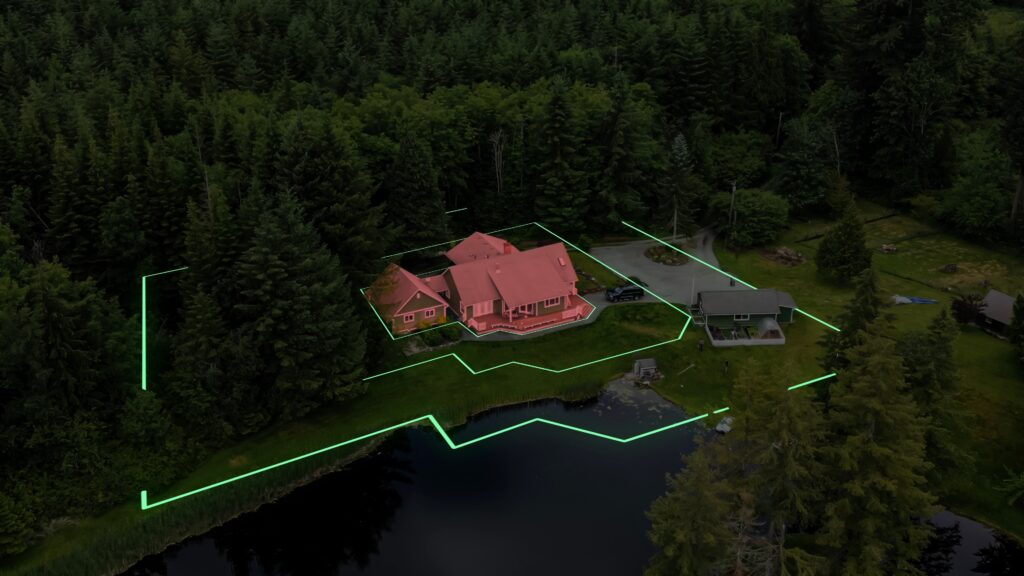
With a moniker derived from “geo,” meaning Earth or land, and “spatial,” which refers to a location in space, geospatial analysis is an analytical technique that involves gathering data about the Earth’s surface (such as elevation, population density) or the built environment (roads, buildings) and using them to make predictions about human behavior or natural phenomena.
In its most primitive forms, geospatial analysis traces back to the earliest forms of cartography and surveying, if not much further. However, the term became associated with geographic information systems (GIS) used to catalog natural resources beginning in the 1960s. Since then, geospatial data has been used in various ways and can span many forms of technology—satellite imagery, GPS, coordinate systems, IoT sensors, and additional location-based data.
Governments use GIS-based solutions for everything from tracking extreme weather events and climate change to measuring and managing traffic patterns to assessing population growth and its impact on energy, transportation, and housing needs as part of urban planning and land management.
Thanks to the revolution in big data, cloud computing, and machine learning, geospatial analytics is now used to find patterns and meaning within geospatial data that can help improve business decision-making, performance, and operational efficiency. Not just at the macro level across large cities, but down to the micro level of a single piece of property.
The Role of Geospatial Analytics in Modern Business
As part of this revolution, geospatial imagery and data visualization have become essential sources of truth because they make geospatial analysis easier to verify and explain. And as the quality and availability of geospatial imagery has increased, so has its utility in modern geospatial analytics-based solutions. Many of these solutions are building a better understanding of a central aspect of the global economy: property.
Property-level data has always been challenging to collect, and for property-related industries such as insurance and real estate, the impact of geospatial analytics on organizations is nothing short of transformational. For example, instead of the time- and labor-intensive task of conducting onsite inspections, critically important information on exterior property condition is available on-demand.
Property Condition: How Geospatial Analytics Works
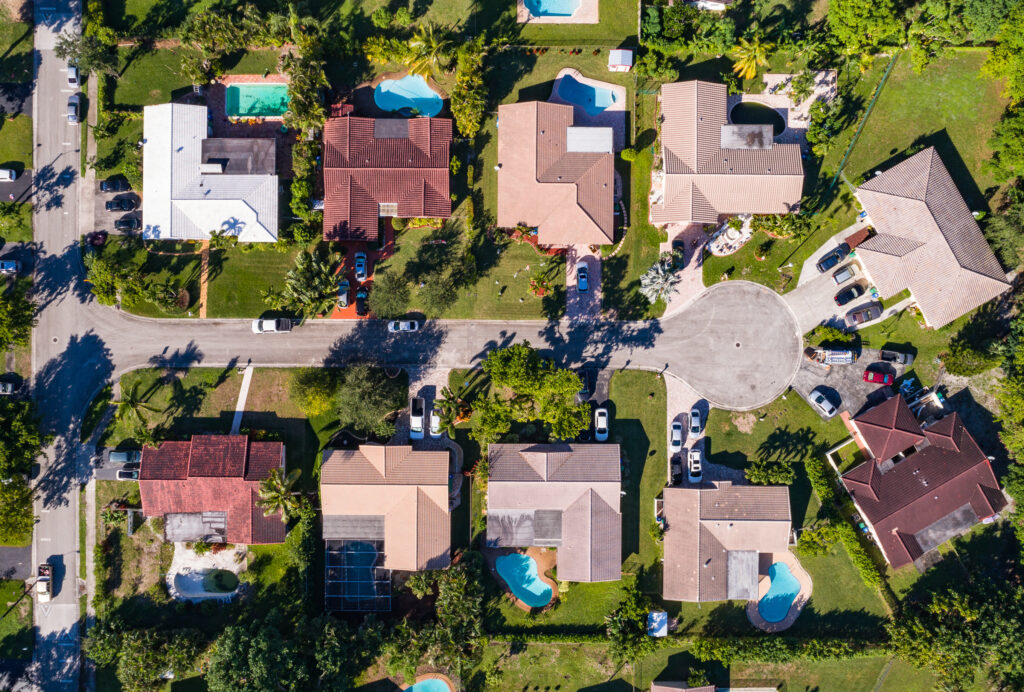
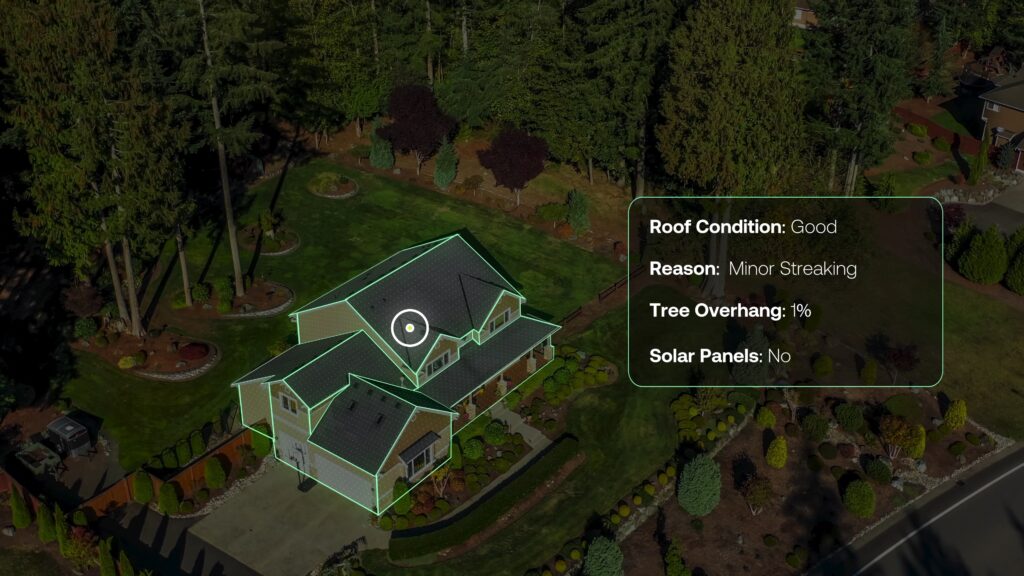
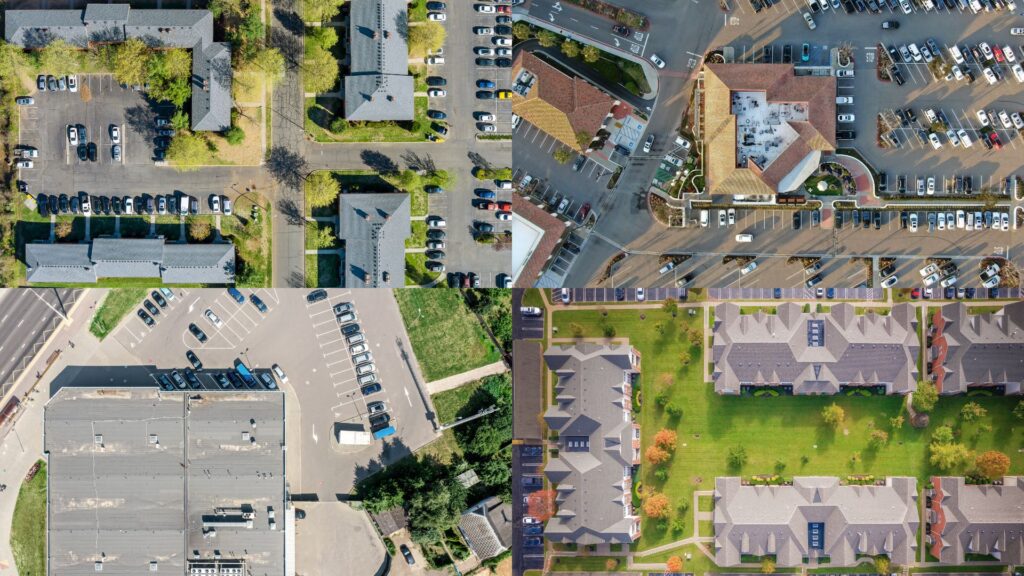
AI-powered geospatial analytics use high-resolution geospatial imagery and computer vision to extract structured data from imagery. When focused on property, this includes the size of a property, type of roof construction and its condition, the presence of solar panels, whether there are overhanging trees, and whether there’s a backyard swimming pool, yard debris, or vegetation encroachment around the property that could pose a fire danger, and more.
Today’s most advanced solutions can provide this kind of data for more than a hundred million commercial and residential properties nationally, delivered with the speed and coverage of traditional property record data.
By providing instant, accurate intel on property conditions, modern analytics enables users to assess a specific property, as well as compare it to similar properties within the same neighborhood, zip code, city, region, or by type—across the nation or, as Deloitte points out, right next door. They can also analyze local, regional, and national trends that impact its value or risk profile over time.
The value of this intelligence depends on the resolution and recency of the imagery it uses and the machine learning put in place to analyze it. To understand why, let’s start by examining different types of geospatial imagery used for various kinds of data visualization and analysis. Different sources of image-capture methods come with distinct pros and cons, and manual review of these images by analysts presents its own issues.
Remote Sensing Data & Geospatial Imagery
Remote sensing is a technique that uses imaging from satellites, aircraft, and other sensors to capture information about the Earth. There are different forms of remote sensing data—but geospatial imagery is the most powerful for property-related analytics.
Geospatial imagery is available at different resolutions and refresh rates. Today, manned aircraft rank among the best resources for high-resolution geospatial imagery with wide coverage of highly-populated areas every few months. Hence, the images have excellent data currency at a reasonable price. Drones and stratospheric balloons are quickly becoming additional sources of high-resolution imagery with recency measured in days and perhaps someday, real-time.
Machine Learning & Computer Vision
In a world awash with data, spatial analysis is often the first step to understanding and analyzing geo-referenced data. However, it can be difficult for analysts to go about this process at scale, as most tools are designed for smaller datasets or single users.
Thanks to the rise of machine learning and computer vision, we can use algorithms to create far more powerful and accurate analyses that provide new insights and correlations otherwise unachievable. By combining machine learning and advanced data science techniques, geospatial analytics are further turned into predictive analytics, capable of spotting trends as they take shape.
Use Cases: From Imagery to Intel
Transforming imagery into structured data (i.e., useful information) is intricate and requires a substantive level of expertise.
At CAPE, for instance, we begin by knitting together a coast-to-coast view of the United States using geospatial imagery provided by our imagery partners. Then, we deploy tailored computer vision algorithms to identify key elements in the imagery relevant to risk analysis and valuation. Next, additional data, ranging from parcel information to recent weather events to hazard information, are layered in via machine learning to create a comprehensive view of a given property. Finally, the outputs are returned as structured data linked to an address.
To understand how this kind of AI-enabled geospatial analysis can be put to use—let’s look at use cases within the insurance and real estate industries.
Insurance Underwriting
The business intelligence gleaned from geospatial analytics help insurers select better risks, reduce expenses, and improve the customer experience in a number of ways.
– Residential Property
Over the last few years, high-quality data on property conditions, prospective customers, replacement costs, and more have become widely available through public records, credit bureaus, analytics providers, and more. Yet few carriers use this data, and fewer still can operationalize it effectively on their own. The consequences include continued reliance on inaccurate data that can lead to excessive exposure when quotes are too low and premium loss when they’re unnecessarily high. It also propagates dangerous levels of underinsurance.
Carriers like Kin and Florida Peninsula are turning to geospatial analytics for the most recent and accurate property information, including critical risk factors with proven loss-predictive power, to improve on their traditional data sources. This gives them the confidence to accurately price risk when offering online quotes to customers shopping for homeowners insurance online. Geospatial analytics also helps insurers catch undesirable risks earlier, fast-track desirable risks, and make faster and more accurate underwriting decisions while reserving physical inspections for situations that warrant additional scrutiny.
Roof Condition Rating (RCR), created by the team here at CAPE, analyzes every roof on more than 110 million structures nationwide, rating them on a five-point scale ranging from severe to excellent. All available through API and easily integrated with underwriters’ existing workflows. It’s worth pointing out that this is also without the need for expensive, time-consuming physical inspections.
Then there are renewals. After a property is underwritten, the profile on that property is often never updated again. By incorporating timely geospatial property data analytics into renewal workflows, insurers like CSAA reduce inspections of roofs known to be high-quality, provide more accurate pricing at renewal, and help members proactively mitigate future risk by cutting vegetation back before damage occurs. With automated change detection, insurers can also know when a property’s risk profile has meaningfully changed and right-size insurance coverage to offer the best protection.
– Commercial Property
According to McKinsey, insurers employing advanced data analytics technologies can see loss ratios improve up to 5%, premiums rise as much as 15%, and retention of their most profitable segments climb as much as 10% compared to rivals.
For example, structured property condition data enables commercial property insurers to power more scalable workflows and avoid costly mistakes. Our own customers report that at least 20% of past underwriting or inspection decisions would have been different if more accurate property condition data had been available.
But deploying AI-powered geospatial analytics is no small matter in a sector marked by high policy acquisition costs and the need for a 360-degree understanding of thousands of discrete risk elements associated with multi-structure, “campus”-style properties. Even as geospatial property data grows more available, the time and resources involved with managing multiple data providers and synthesizing vast amounts of often contradictory data is unrealistic for most commercial carriers. Yet the cost of operating without this kind of intel or drawing the wrong conclusions from it can be harrowing.
This is especially true when you consider that commercial property underwriters have to contend with the roughly half of all incoming Statement of Value (SOV) submissions that suffer from variabilities and inaccuracies—including irregular data with unstandardized or incomplete addresses, bad geocoding, and cumbersome document types such as emailed spreadsheets, forms, PDFs, and even pictures of a piece of paper. This only exacerbates efforts to leverage data and automation technologies. Instead of what should be instant, a human must map the available information in the SOV to a real-world property—a tedious and time-consuming process.
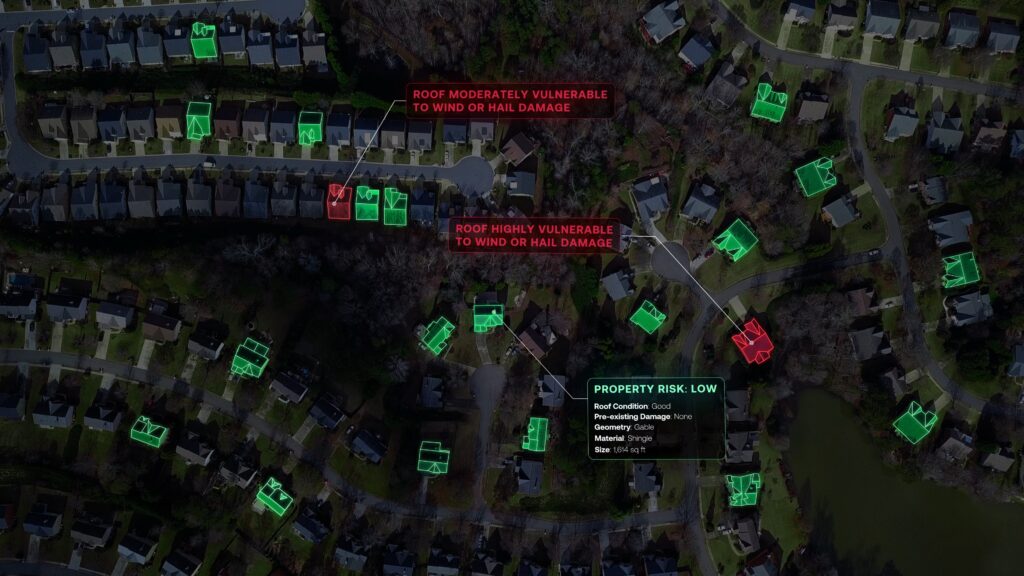
For this reason, solutions that leverage AI-powered geospatial analysis and at-a-glance condition scoring with visual highlights of structures that need attention are especially valuable. CAPE’s Property Mapper technology, for instance, enables insurers to enter the address of a habitational complex or corporate campus and automatically get an instant view of the industry’s best construction, occupancy, protection, and exposure (COPE) data for each structure on the property. This includes roof type, geometry, materials, sizes, and more—for every structure that is associated with that policy.
The Hartford, Mercury Insurance, and other insurers leverage this and our commercial property intelligence to unearth insights on commercial property risk through the power of geospatial analytics. Building roof condition, for instance, is linked to higher wind and hail losses and business interruption claims. Likewise, lot debris is linked to liability losses. In addition to helping insurers avoid unnecessary inspection costs, post-bind pricing changes, and unexpected downstream losses, geospatial analysis enables innovative new underwriting strategies.
– Natural Catastrophes: Wildfire, Wind, and Hail
Homes and businesses with a large amount of foliage overhanging a roof experience 90% higher wind-related losses and account for up to more than 45% of insurance claims, with hailstorms as a significant and growing driver. Our research has found that properties experiencing a higher frequency and severity of hailstorms in the previous two years are 50% more likely to have future claims due to undetected damage.
Meanwhile, homes continue to be built in areas with high wildfire risks—especially in the American West. Despite the availability of wildfire risk data, a recent study found that 30% of legacy insurance systems lack accurate information on the type and age of a dwelling’s roof or its distance from a fire station. No wonder more than 60% of US homes are “woefully underinsured” against wildfire—or any other peril for that matter. Factor in the impact of rampant inflation and these problems are only compounded.
Modern geospatial analytics solutions can provide insurers with on-demand access to structured data on important wildfire risk down to the specific property level, including proximity to surrounding fuel load. According to our data, homes in very high-hazard zones with heavy vegetation coverage have 5X higher losses than those with more defensible surroundings. By identifying property attributes such as roof geometry, insurers can better capture premium, triage inspections, and avoid unexpected losses.
Real Estate
Just as with insurers, AI-driven geospatial analytics is rapidly gaining the real estate industry’s attention precisely because viable alternatives for fully understanding property risk are often unavailable, not granular enough, or are outdated. These technologies represent a quick, lean, and affordable way to understand assets all the way down to zip code, neighborhood, and individual-address level.
Best-of-breed solutions, like CAPE’s Automated Property Condition Report (or aPCR), harness geospatial analytics and powerful AI analytics to provide instant, objective property condition information derived from aerial imagery and other data sources. This intelligence can be easily integrated into existing valuation workflows and is always available on-demand via API, in bulk data, or through a dynamic web application.
Such technologies dramatically enhance decision-making for interests throughout the real estate ecosystem, including the following.
– Home Equity Lending
Home equity lenders often supplement automated valuation models (AVMs) with a traditional property condition report (PCR). But for many, a better choice is leveraging AI-based geospatial analytics technologies that catch the 70% of issues missed by PCRs. Credit unions and other equity lending organizations can use this intelligence to gain objective and current property condition assessment.
Organizations can also strike the right balance between automation and human intervention. For instance, lending applications can be routed to the property valuation methodology automatically, completely automating approvals on the spot when possible while reserving home inspections for when they really matter. Among other benefits, this can help credit unions cut closing times from 40 days to 20 or even ten business days.
– Loan Origination and Servicing
Originators and servicers can use geospatial analysis to better value and assess property. They can use geospatial intelligence to identify properties that differ from existing data sources, including insights on roof condition, the presence of accessory structures, and more. With this augmented information in hand, they can optimize or expedite the property inspection process and automatically understand if important changes to property condition may affect the collateral value.
– Loan Trading
Geospatial analysis is increasingly used to augment traditional data with additional condition variables that can significantly improve valuation and pricing models for better-informed decisions. For many, broker price opinions (BPOs) and appraisals are too costly and time-consuming for a marketplace that demands split-second decisions. And even sophisticated AVMs can miss critical details that impact financial decisions.
Using geospatial analytics, loan traders can identify outlier properties and quickly determine whether target properties are in good condition or estimate rehab costs. They can also optimize or expedite the property inspection process while monitoring existing positions to ensure collateral remains in good condition.
– Multi-property Investment and Management
These factors are of particular interest to investors competing for single-family rentals (SFRs). Because traditional AVMs and drive-by inspections can miss critical and current property features that impact rehab cost and value, their usefulness in the modern world of SFR investing is limited—at least on their own.
Whether they’re exploring a single property or shopping nationwide, geospatial analysis enables investors to instantly access a neighborhood, census tract, zip code, or CBSA-level data to zero in on the most promising regions and properties. They can also review aggregate changes over time to unearth trends (both good and bad) to identify the best markets to enter.
Emerging Applications: Endless Possibilities
These are just a few examples of how CAPE applies geospatial analytics today. However, these data-driven technological capabilities have many other potential use cases. Roofing, solar panel installation companies, and others can use it to conduct remote inspections for prospecting and quoting. So can property and landscape management companies.
Local governments can conduct property tax assessments far more efficiently. Telecoms and other utility companies can identify towers at risk from vegetation overgrowth to manage clearance operations. And geospatial analytics’ value to FEMA and other emergency response organizations may be immeasurable after catastrophic events. For geospatial analytics, the sky’s the limit.
To learn more about use cases for geospatial analytics in industries such as insurance and real estate, visit capeanalytics.com
Aggregate Statistics Created Using Data Produced from Nearmap Imagery