Climate Risk: Geospatial Property Analytics Now Critical to Real Estate Investment Strategy

Turns out it’s “Code Red” for real estate investment. In the aftermath of the 26th United Nations Climate Change Conference (COP26) in Glasgow, look for real estate investors, lenders, and traders to increasingly leverage geospatial property analytics to factor evolving climate risks into their investment strategies.
From the sound of things, it may be a smart move. The focus of COP26 was a groundbreaking UN report characterized as “Code Red for Humanity” that waxed apocalyptic about our not-too-distant future. Think melting ice caps, interminable heat waves, rising sea levels, violent storms—and the persistent flooding, drought, and wildfires that will accompany them.
While the report suggested there’s still time to mitigate the worst effects of climate change, there is no longer any way to prevent temperatures from rising roughly 1.5 degrees Celsius over the next two decades.
Even in the best-case scenario, the risks associated with that rise create a tricky new calculus for real estate investment strategies as historical market data grows increasingly irrelevant. The challenges—and (carefully chosen) opportunities—could be enormous.
The Climate Crisis: No Longer ‘What If’
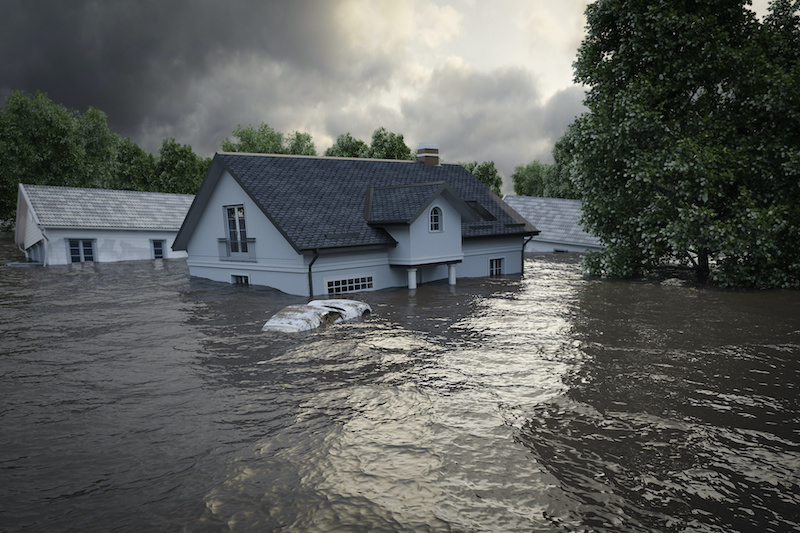
Today, 4 in 10 Americans live in coastal areas that could experience declining home values as the once theoretical notion of rising sea levels becomes painfully real. For SFR investors and lenders, that could mean getting saddled with properties that are prone to flooding or permanently (excuse the term) underwater.
Weather-related storms are also increasing. From 2000 and 2010, the US saw an average of fewer than eight $1 billion weather- and climate-related disasters per year. In 2020, there were 22. By 2050, it’s estimated that climate-related damage from rising seas and storms along US coastlines is projected to cost cities as much as $1 trillion per year.
According to CNBC, this is already resulting in mortgage lenders and insurers engaging in “underwaterwriting,” drawing lines of risk around certain streets or neighborhoods at risk from flooding or rising seas.
The western US faces a different problem. Drought-stricken Utah, for instance, was the fastest-growing US state over the last 10 years. But as our own data points out, the state has the highest percentage of new housing developments in high fire risk zones, a situation that will only worsen as temperatures continue to rise.
Property Analytics to the Rescue?
In recent years, AI-based geospatial property analytics has emerged as a way for SFR investors, lenders, and traders to quickly identify the best real estate investment opportunities at scale.
But solutions like ours also enable users to monitor changes over time at the property, neighborhood, census tract, zip code, and CBSA level so they can unearth trends impacting value—including growing risk from fire, extreme weather events, flooding, rising sea levels, and more.
This will prove critical to identifying the knock-on effects of climate trends, as well. The fact that a home has been “climate gentrified” to withstand the effects of climate change is important to investors, for instance. But so is the fact that two other houses on the same street were recently bought and razed by the city due to flood risk—or that the same is true for a plant belonging to the area’s largest employer.
Tending to the Day-After-Tomorrow
There is a more sobering aspect to all of this, too. In the US, climate-related catastrophes have traditionally led Americans to channel our inner Rocky Balboa: We get knocked down, and we get up again. But while this will surely continue as long as it can, understanding housing markets beyond today’s booming-but-vulnerable population centers isn’t just shrewd. Now that we’ve hit Code Red, it may also be essential.
To learn how geospatial property intelligence can help you grow your business and improve your investment strategies in the face of climate change, request a demo at capeanalytics.com