Accurate Living Area Data: A $2 Billion Opportunity for Property Insurers

Accurate living area information is as critical to capturing premium and reducing the protection gap as it is nearly impossible to verify through the sources most property insurers rely on. Now, a growing number of carriers are turning to AI-based technology to change that.
For many, it’s a matter that has taken on new urgency in the face of a hardening market, inflation, rising CAT risks, and mounting underinsurance. While it may seem like a mundane metric, ascertaining living area isn’t just about square footage. It’s about the accuracy of the measurements insurers use to price risk, calculate replacement costs, and suggest adequate coverage levels to policyholders. Even slight discrepancies can lead to significant underestimations—exposing policyholders to financial risk while leaving premium on the table.
The Accuracy Imperative: Why Living Area Data Matters
Living area is central to calculating Coverage A, the lynchpin of homeowners policies. Insurers rely on accurate living area data to assess risk and set premiums. They also use this information to determine other coverage selections—including contents, additional living expenses, and specific deductibles. As a component of Coverage A, living area factors into a carrier’s exposure across their entire book of business.
At scale, small inaccuracies can have enormous consequences—especially when you consider today’s property insurance landscape. Since 2020, the cost of home construction materials has increased 35.4%, while labor costs have climbed 30%. As it stands now, roughly two in every three homes in the US are underinsured. On average, these homes are underinsured by 22%, though underinsurance levels can reach 60% or more.
In the aftermath of a natural catastrophe, these figures only grow worse. Just look at Lahaina, Maui, where insured losses from last summer’s wildfire topped $1 billion while total damage reached $6 billion or more. Or take the large swaths of suburban Colorado that were decimated in 2022’s Marshall Fire. According to the New York Times, only 8% of homeowners’ policies impacted by the blaze covered rebuilding costs, no matter the price. As many as two-thirds of all affected homes were underinsured. Accurate living area data can help homeowners and insurers avoid these scenarios.
Garbage In, Garbage Out: Impediments to Adequate Coverage
Today, the average size of a single-family home in the US is approximately 2,301 square feet. However, it isn’t easy to get accurate living area measurements on a property-specific basis.
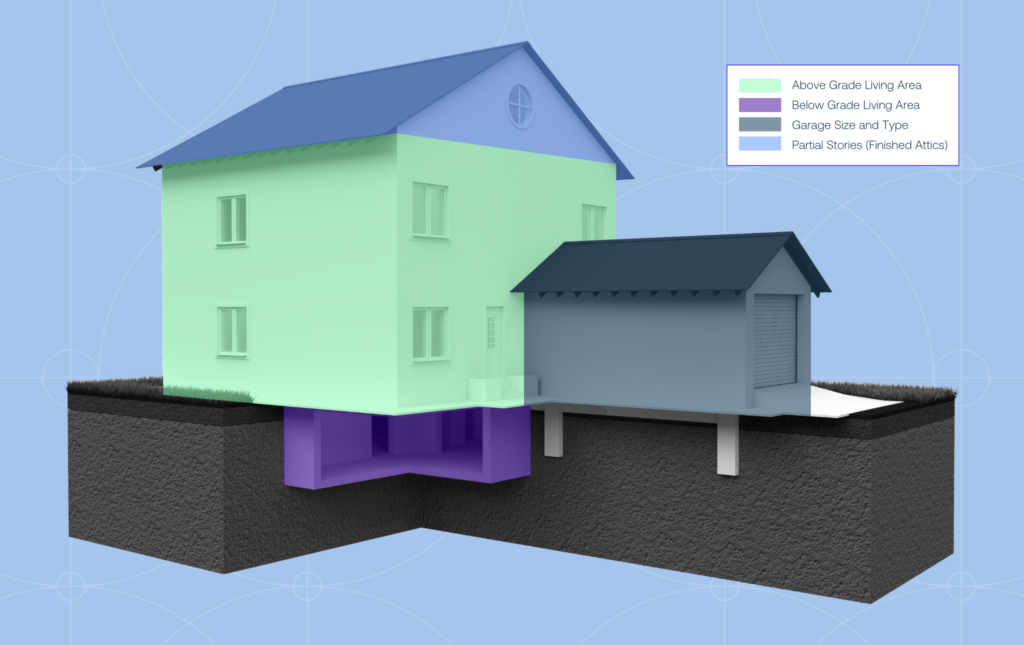
Public records are a primary source of living area data in 3,000 counties nationwide. Unfortunately, each of those counties also has its own standard for reporting what the “living area” actually is, which can mean below-grade, garages, or finished attic living spaces can be handled in a variety of ways. And information recency can depend on the property’s build, remodel, or sale dates.
Living area data can also be gleaned from agent portals, raters, or even directly from the homeowner. In these cases, information is often entered by agents seeking the best coverage at the best price. Even the homeowner isn’t likely to possess detailed figures on living area, let alone be well-versed in how finished sub-areas are broken down, as may be required by carrier replacement cost tools.
Together, these issues form a shaky foundation for Coverage A estimations. For carriers, it can be difficult to isolate a starting point at which to begin to fix this. They can ignore the problem and accept persistent underinsurance and data inaccuracies as the status quo. They can attempt to model away the gaps, utilizing a high degree of effort to attain an uncertain result. They can inspect everything and expend the time and money that come with that. They can also factor additional questions at quoting or renewal and hope the customer friction it introduces is somehow mitigated by any modest accuracy improvements they might gain.
At CAPE, we understood from the beginning that solving this issue required a fundamentally different approach.
Ending the Unknowns: Unlocking Massive Opportunity
As providers of AI-powered property intelligence used by US property insurers, CAPE has long leveraged high-resolution geospatial imagery and the industry’s most accurate machine learning models to help carriers understand and price risk quickly and accurately. So we understood that an AI-backed, multi-source approach would be needed to address living area data inaccuracies.
CAPE Living Area fuses a wide array of traditional and novel data sources together with geospatial imagery using advanced machine learning techniques to provide the most objective, consistent, and accurate results in the industry. Instead of relying on a single data point as the answer, insurers have corroborative data and imagery at their fingertips for a more holistic view of a property’s living area.
As featured in a recent webinar, CAPE leveraged this technology in a national study that found the percentage of policies containing inaccurate living area data was enough to represent a $2 billion opportunity for carriers—just from making corrections to the most severely underestimated living area values in their portfolios.
For a more complete understanding of the technology and specific findings from the study, contact us here.