All Hail The Roof: New Risk Insights For Property-Specific Hail Vulnerability


Hail has turned into one of the more problematic risks for property insurers. According to the III, the industry sustained over $13 billion in losses in 2019, and in 2020, that number increased to $14.2 billion. Hail-related losses are unpredictable, but generally seem to be increasing due to a number of factors:
- Exposure is increasing due to population growth and additional construction in hail prone areas (particularly in Texas metro areas like Dallas and Houston)
- Research suggests climate change will result in more damaging hail events due to larger hailstones
- Hail as a hazard is expanding beyond traditional areas, further into the Midwest and Southwest
Unfortunately, 2021 isn’t off to a better start; the April 28/29 event in Texas and Oklahoma drove over $1 billion in damage alone, with a possible record-setting 6.4-inch hailstone measured by the IBHS. However, even with this rising peril, there is a dearth of data that would allow insurers to more accurately underwrite and price for hail risk. While modelers and hazard providers attempt to keep up with the expansion of this exposure, carriers and underwriters have had access to very few property-specific insights that can help inform their vulnerability assessments and coverage decisions.
Now, due to the advent of geospatial analytics, available at scale and pioneered by CAPE Analytics, we can begin to understand the impact of individual property characteristics on the likelihood and severity of damage from perils such as hail.
In this post, we will preview a few of our recent findings, and explore the predictiveness of tree overhang, roof area, and roof complexity against our ever growing, customer-contributed claims database. A future white paper will go into more detail on additional attributes and how these characteristics interact, but this post will serve as an initial exploration of the topic, with univariate analyses on the above attributes.
Roof age is just a number
Currently, most insurers look at a mix of roof age, roof material, and living area to determine Coverage A, and whether to select Replacement Cost Value (RCV) or Actual Cash Value (ACV) for the roof. While valuable, these methods represent an imperfect view of the potential and size of a roof claim from a hail event.
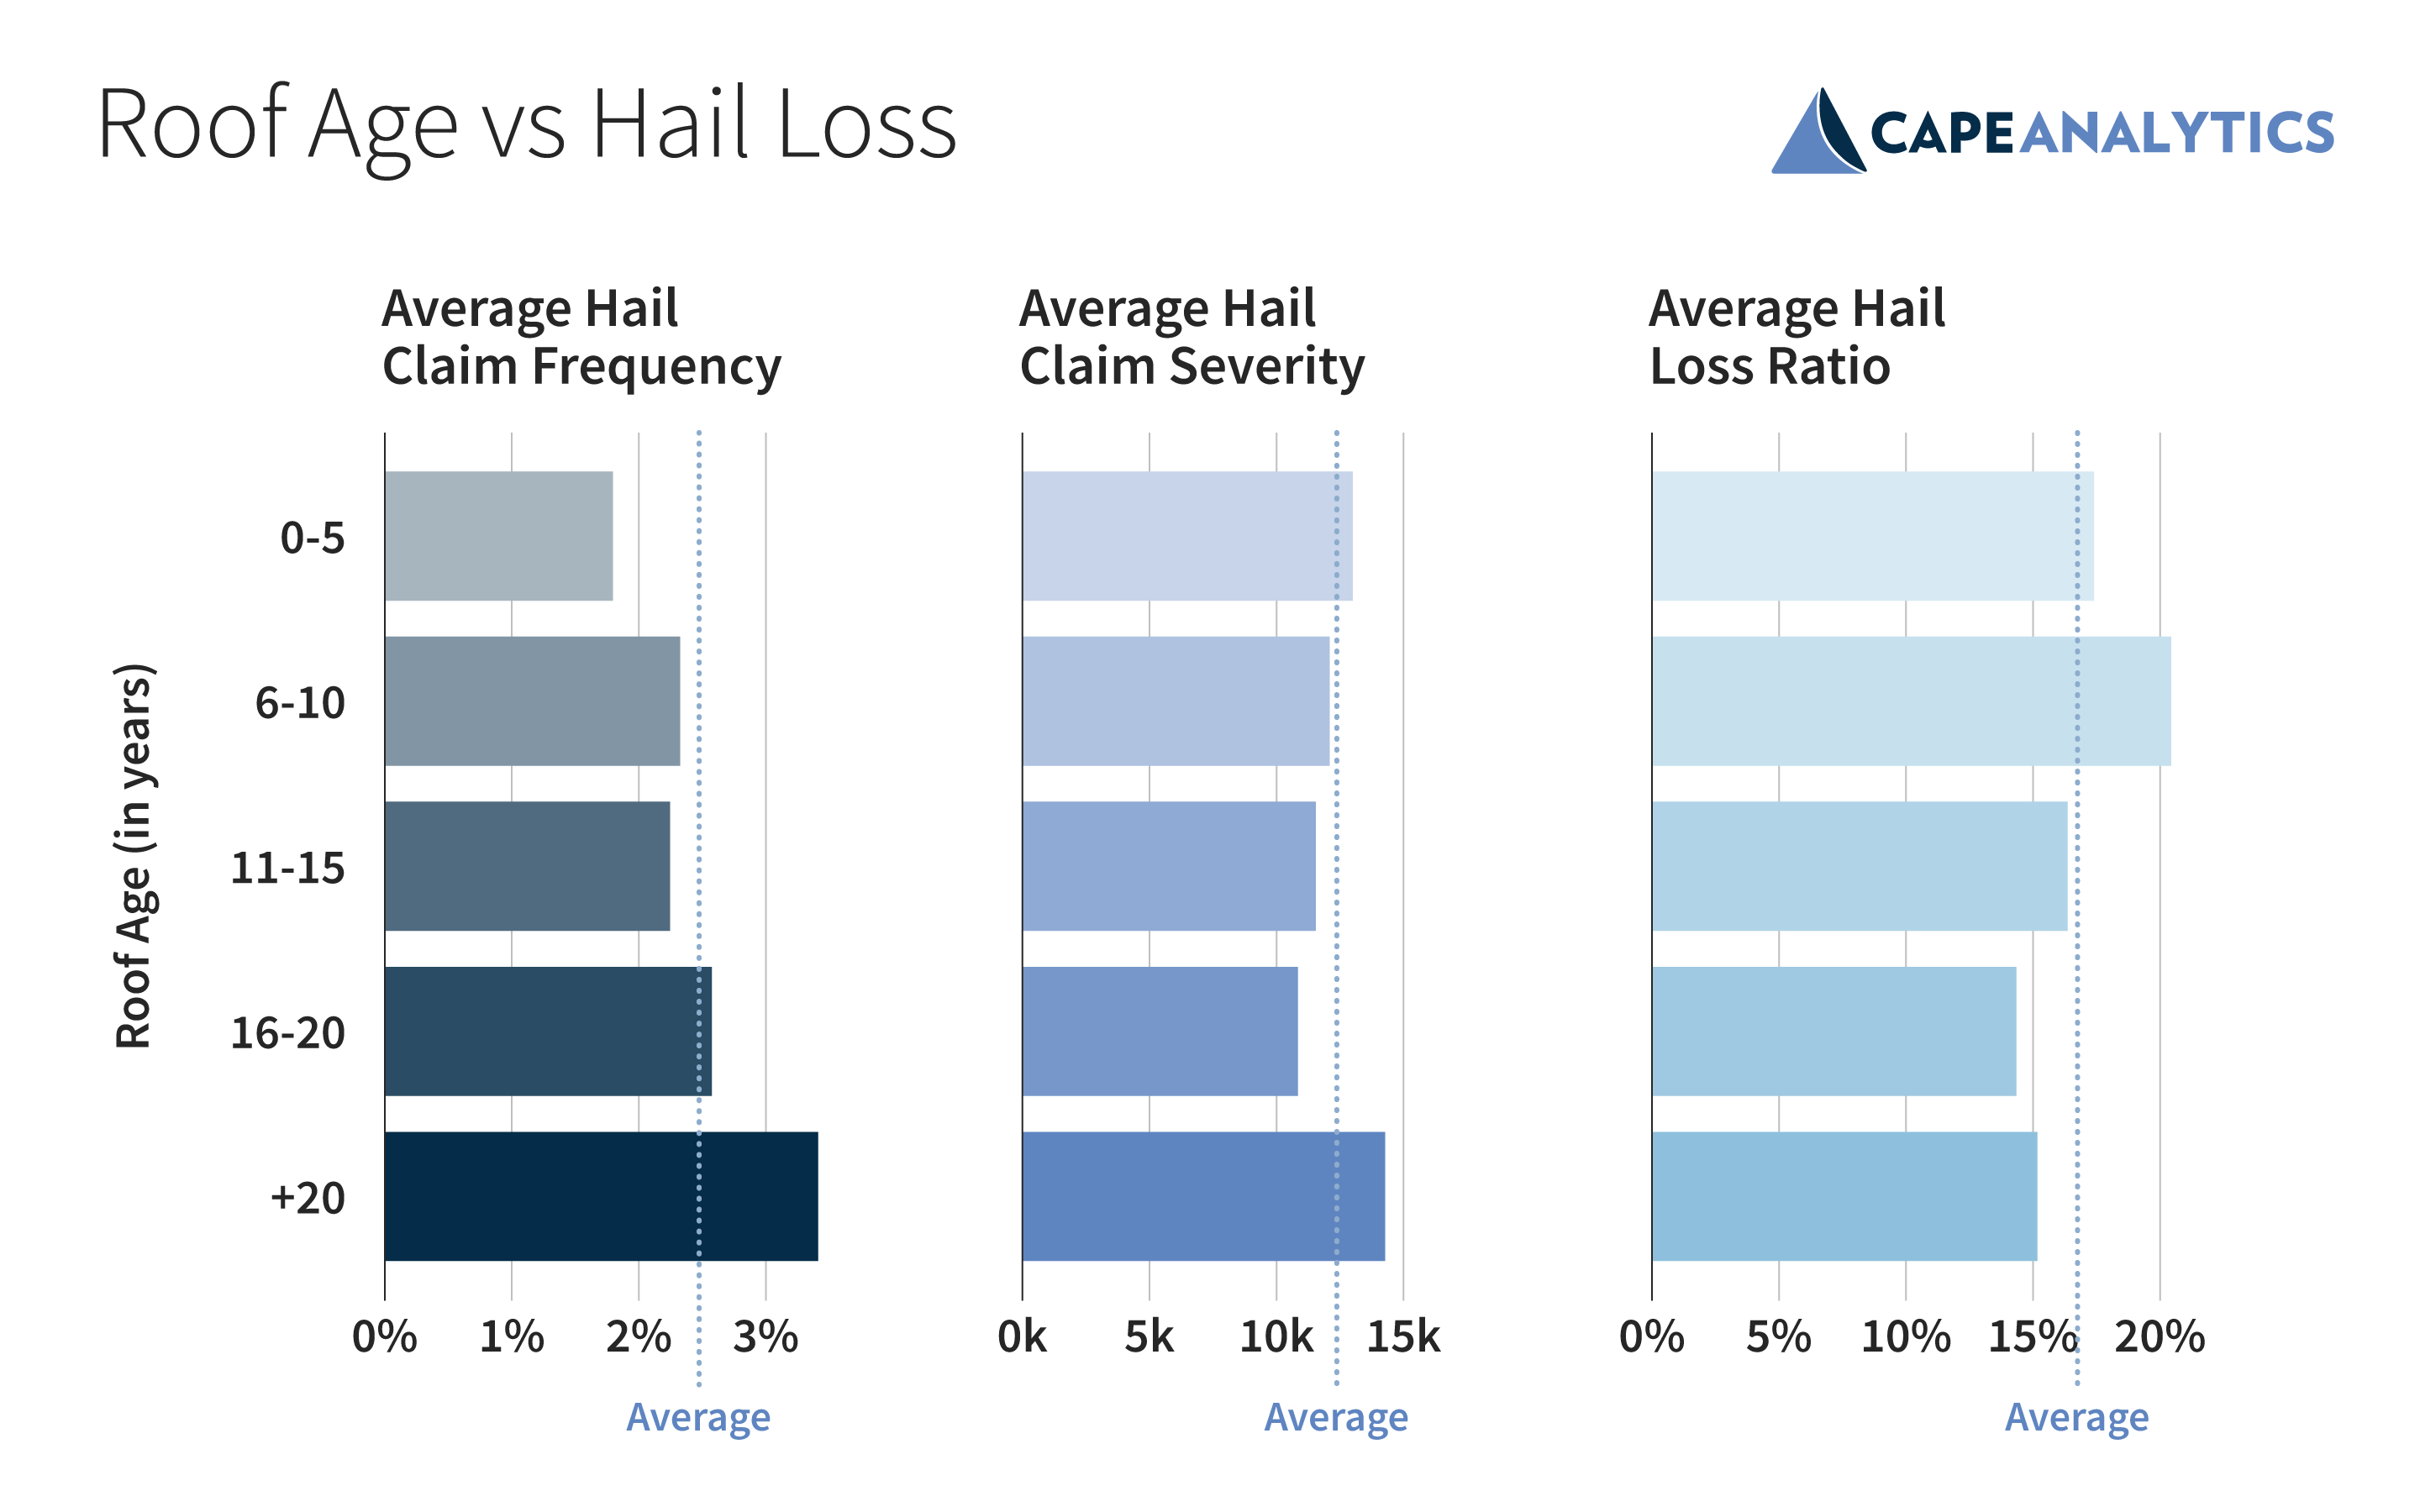
For instance, at CAPE, when we compared roof age against industry losses, we found the highest hail loss ratios were experienced by homes with roofs that were just 6 to 10 years old. This would seem to suggest that, while useful, it is important to go beyond roof age in order to successfully manage hail risk.
The following chart shows these surprising findings in action—while frequency does move mostly as expected (increasing for older roofs), it is not a strong increase until roofs are older than 20 years. Therefore, an ACV approach may not be saving insurers from the steeper losses on newer roofs when it comes to hail. To appropriately assign an accurate premium, carriers must know more about the property in question.
But roof size and complexity matter
While traditional property characteristics represent a useful set of factors, there is still a significant gap in understanding of a roof’s real exposure and vulnerability to hail. We believe the introduction of CAPE-measured roof area square footage and roof facet count (which represents the complexity of a roof), significantly closes the knowledge gap in hail vulnerability.
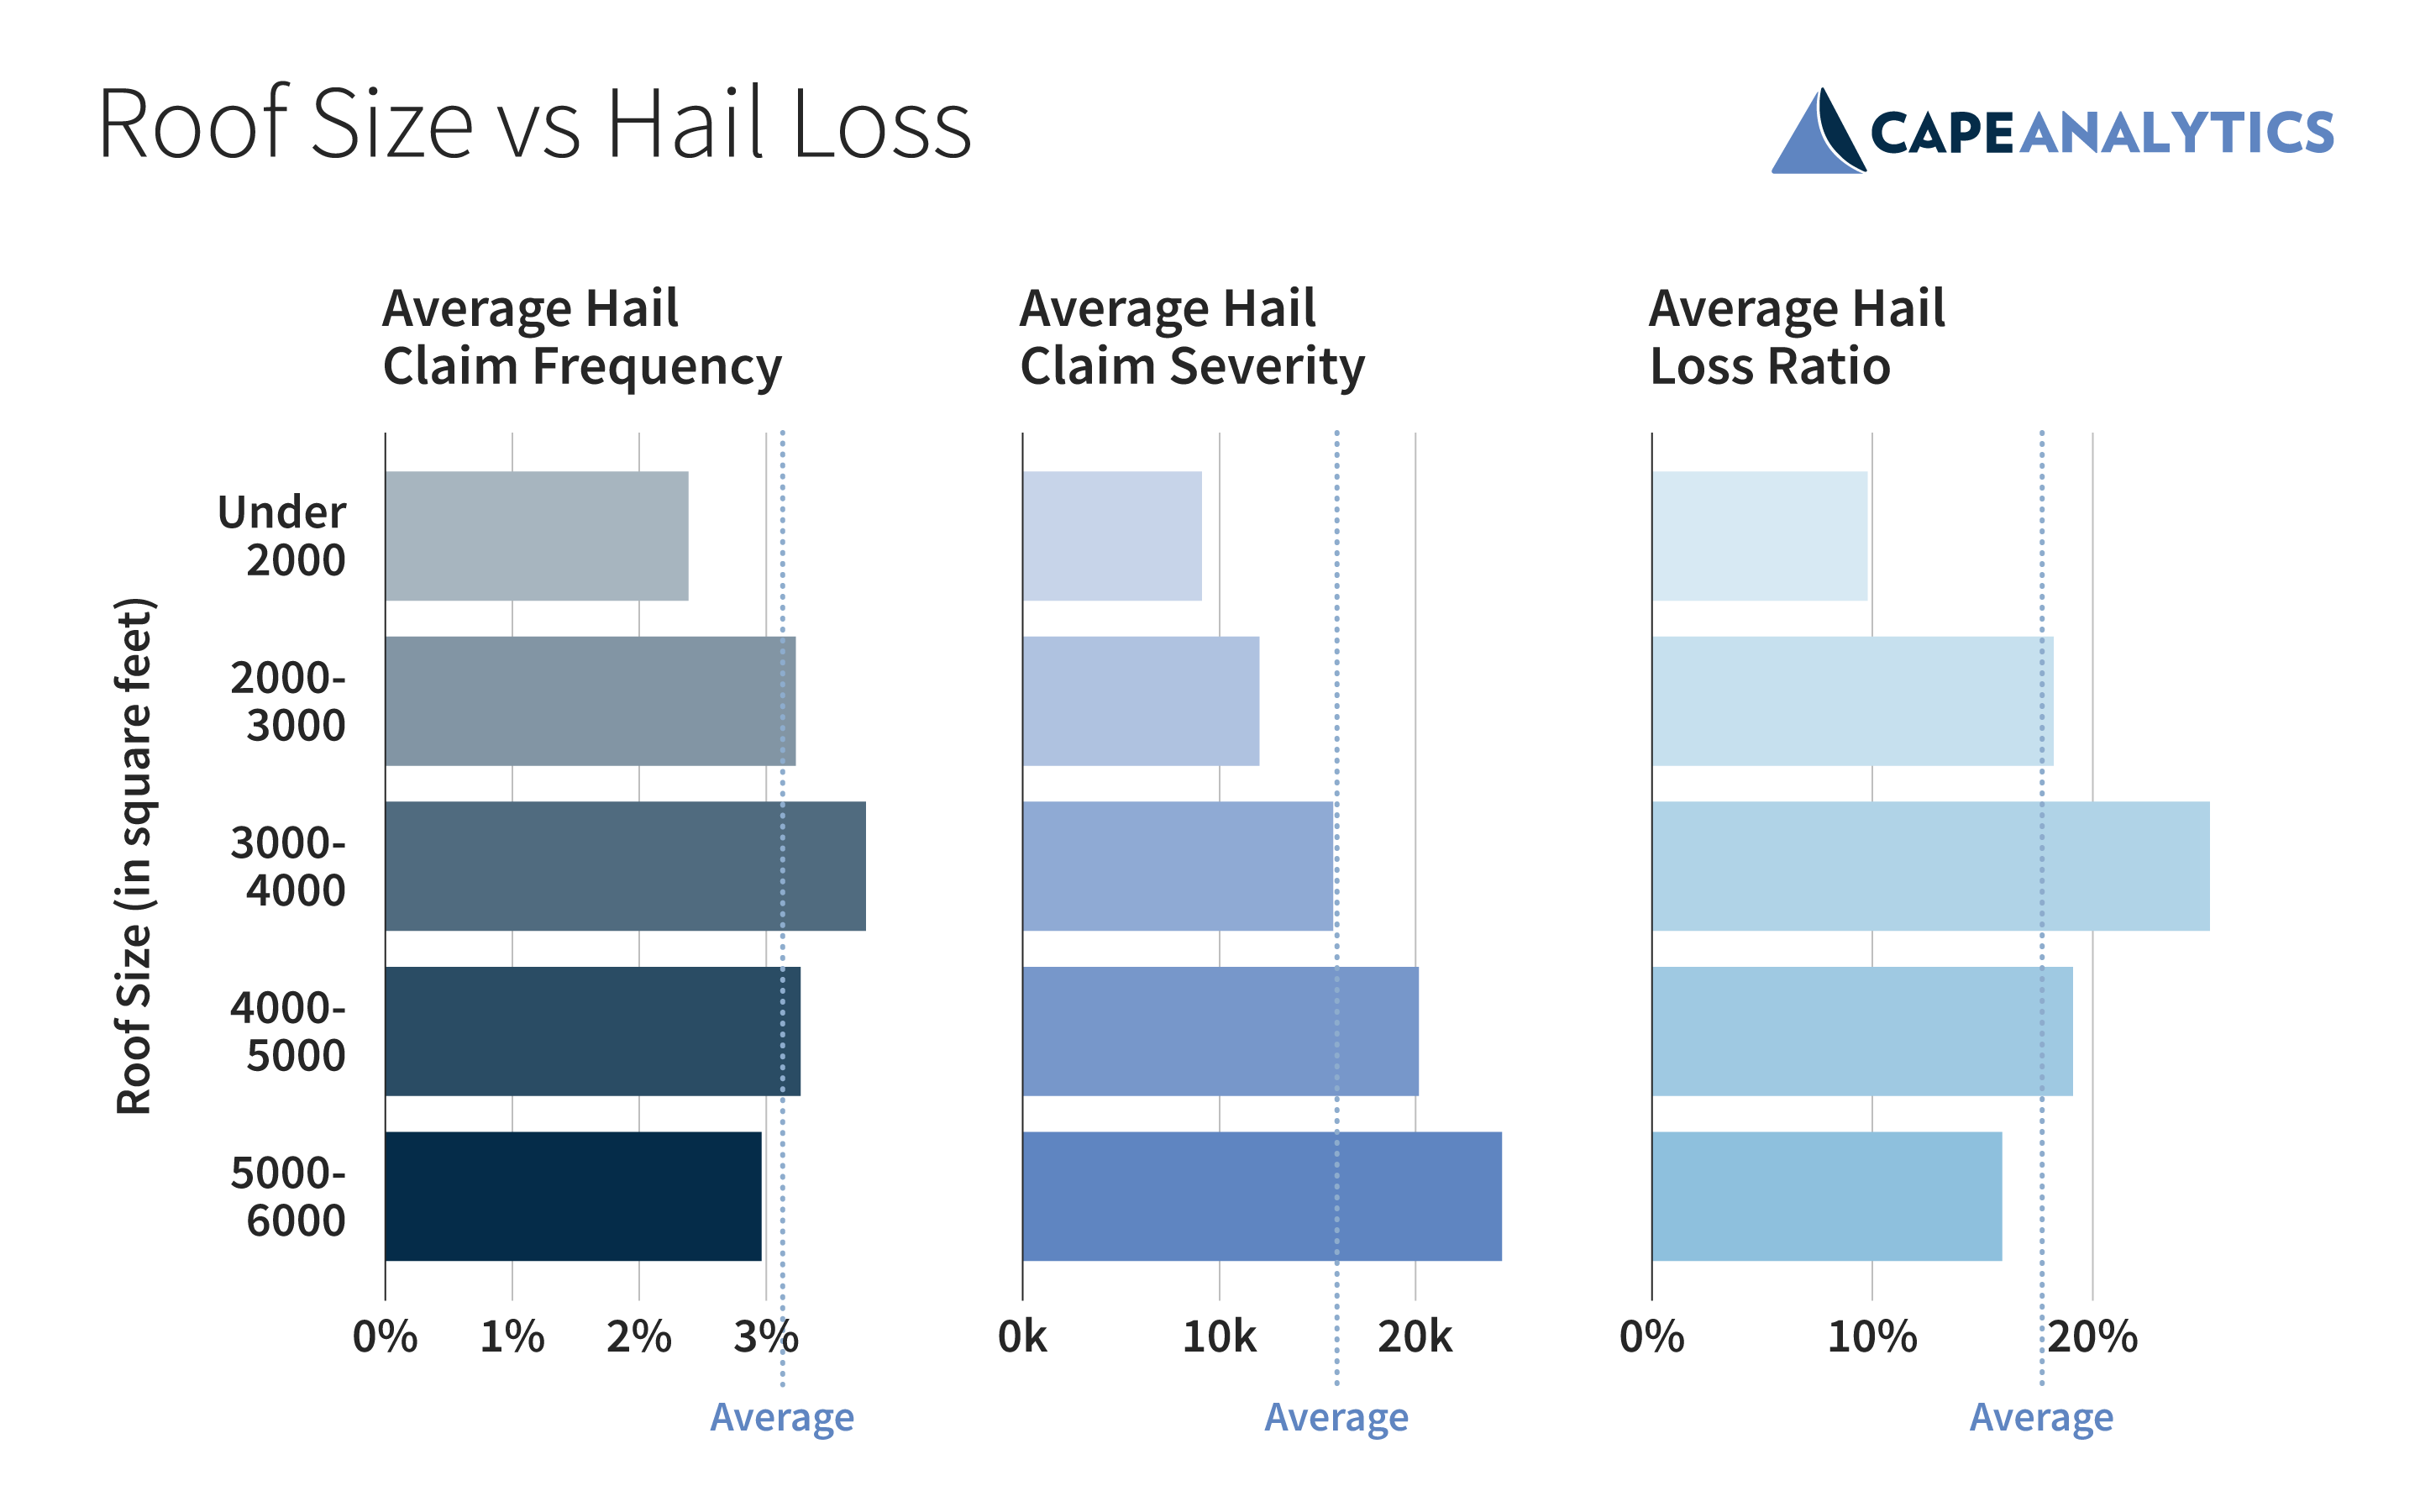
Roof size correlates with more costly claims, and almost universally correlates with higher loss ratio. In fact, homes with 3,000 to 4,000 square foot roofs have 2.5X the loss ratio as homes with roofs under 2,000 square feet.
This relationship does break down when we look at very large homes with roofs greater than 4,000 square feet. While claim severity continues to increase along with roof size, claim frequency drops enough to reduce loss ratios. It’s important to note, however, that only 5% of homes have roofs over 4,000 square feet, so this finding is more applicable to high-value coverage.
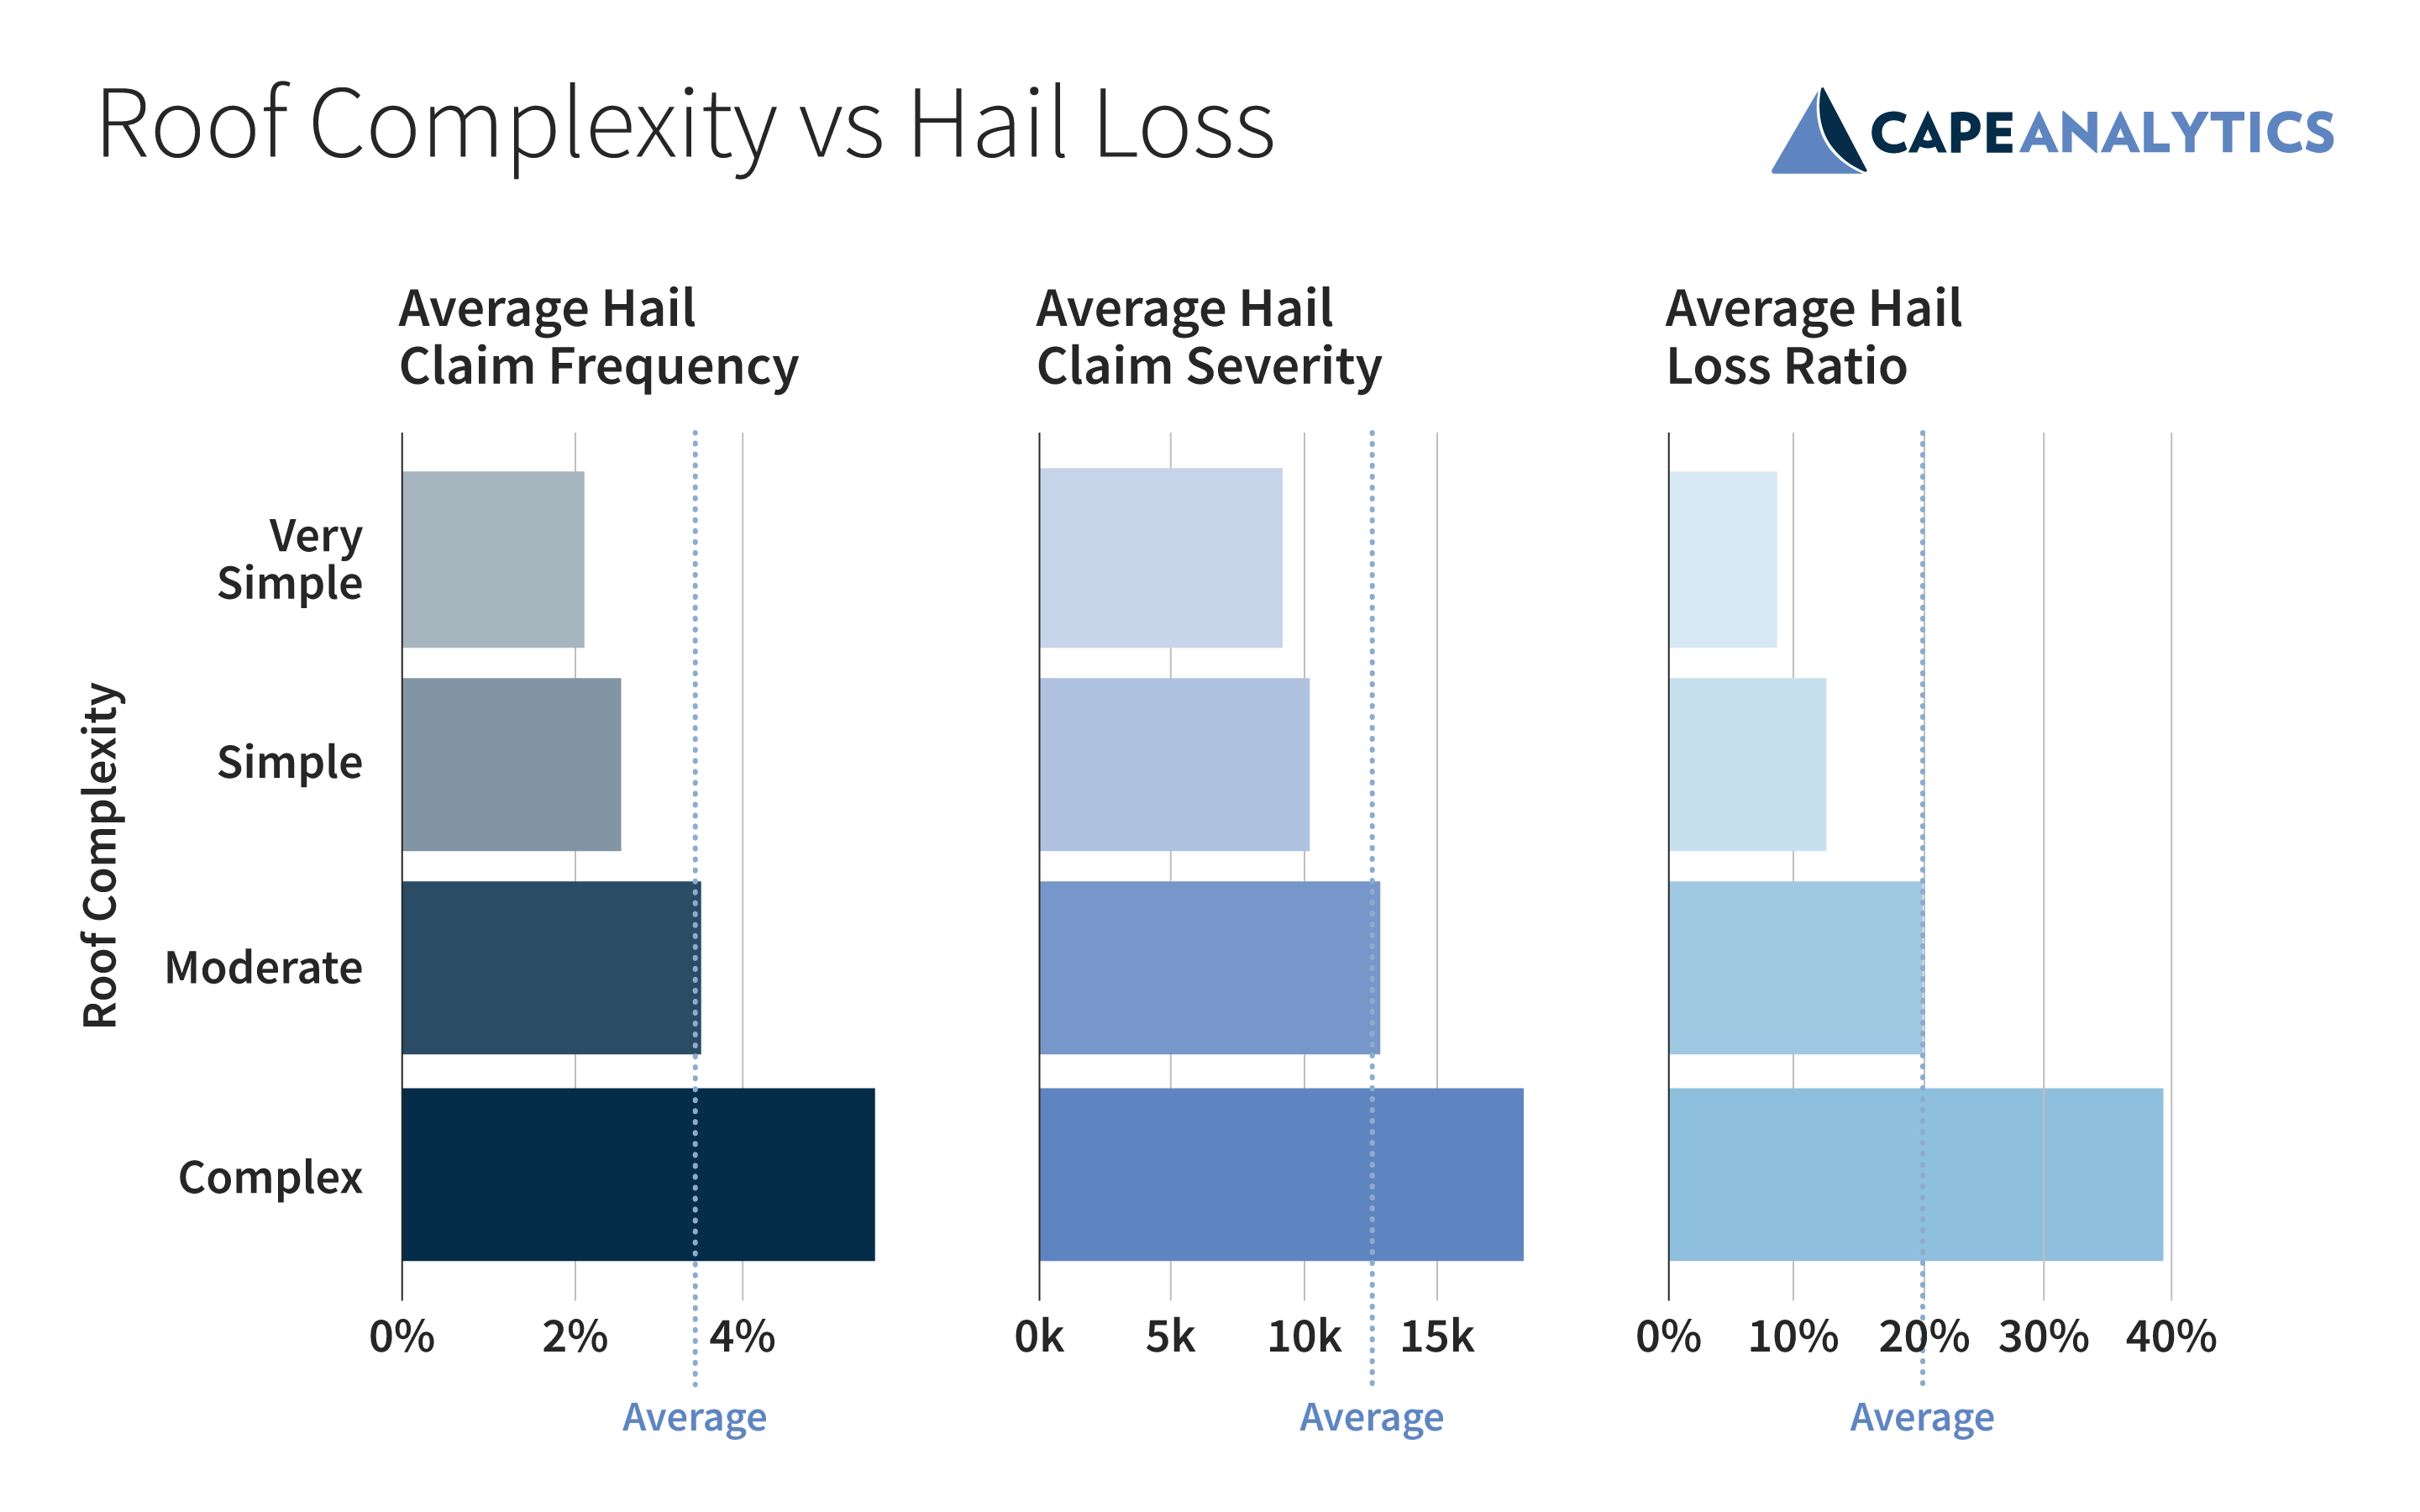
Now let’s look at roof complexity, which is a CAPE-created measure that organizes the number of roof facets into very simple, simple, moderate and complex construction. The signal here is crystal clear across the board and should be noted by actuaries and risk modelers. When it comes to hail, the more facets a roof has, and the more complexity, the higher the loss ratio, claim frequency, and claim severity. Homes with complex roofs have 2.4X and 3.6X the loss ratio of homes with simple or very simple (i.e. flat) construction roofs. Like roof condition with attritional loss, and vegetation for wildfire, the signal shown here makes roof complexity an important property characteristic when determining hail vulnerability.
Still, there is more insight and segmentation potential that can be gained by combining roof complexity and roof size. In the below chart, we can see that moderate and complex roofs can have upwards of 60 percent higher hail loss ratios for “typically” sized home roofs (under 4,000 square feet). Interestingly, the increase in hail loss ratio is not driven solely by claim severity, as one may expect (bigger and more complex roofs tend to be more expensive). These findings show very different claim frequencies between simple and complex roofs, perhaps signaling that more complex roofs tend to also be less “hail ready.” While many carriers use roof area (a number that by itself can be tricky to know with confidence without geospatial AI) to determine coverage A, including roof complexity allows for additional and more refined segmentation.
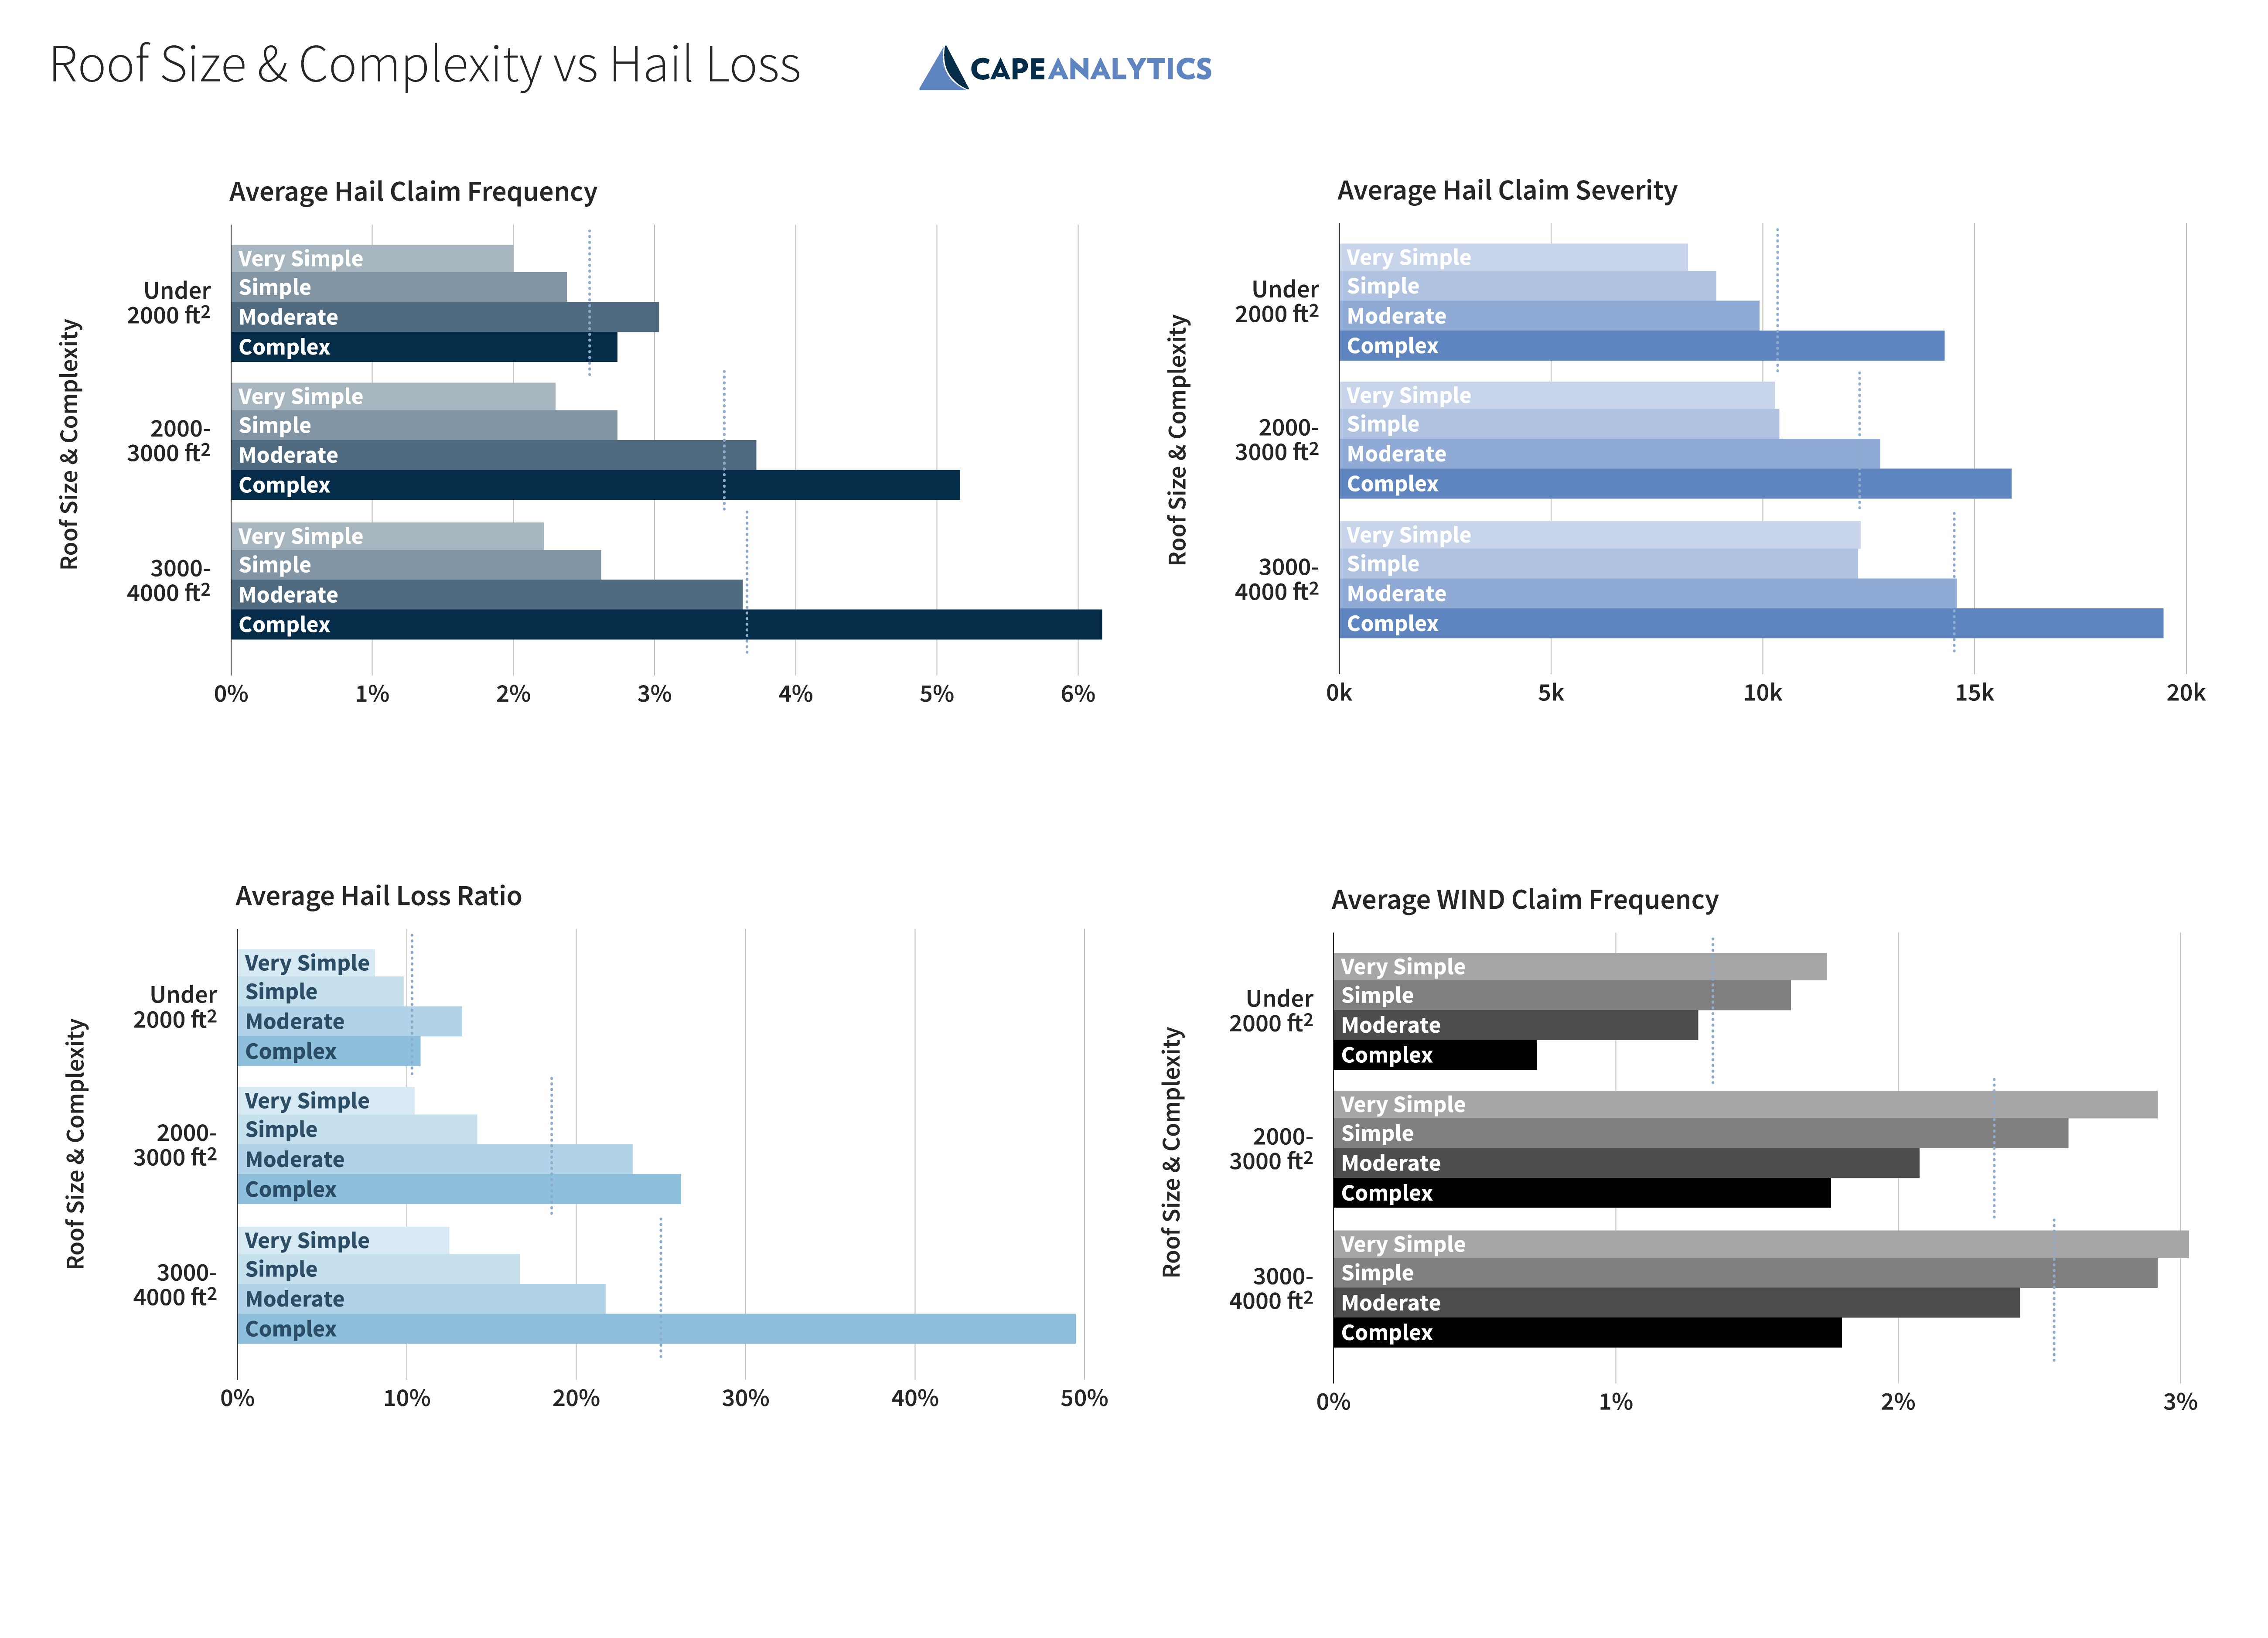
Of note, the signal for a combined roof complexity and roof size measurement has an opposite signal when looking at wind-driven loss ratios. As we’ll see in the next section as well, the predominant hazard type (wind or hail) from region to region should be a major consideration by underwriters and actuaries.
Sometimes it’s good to throw shade
At CAPE, we’ve also discovered an interesting correlation between tree overhang and hail loss, which we have published in earlier Fast Facts. Tree overhang is typically associated with a higher wind-hail loss ratio. However, this signal is diluted when region and peril are not specified, as can be seen in the chart’s first row.
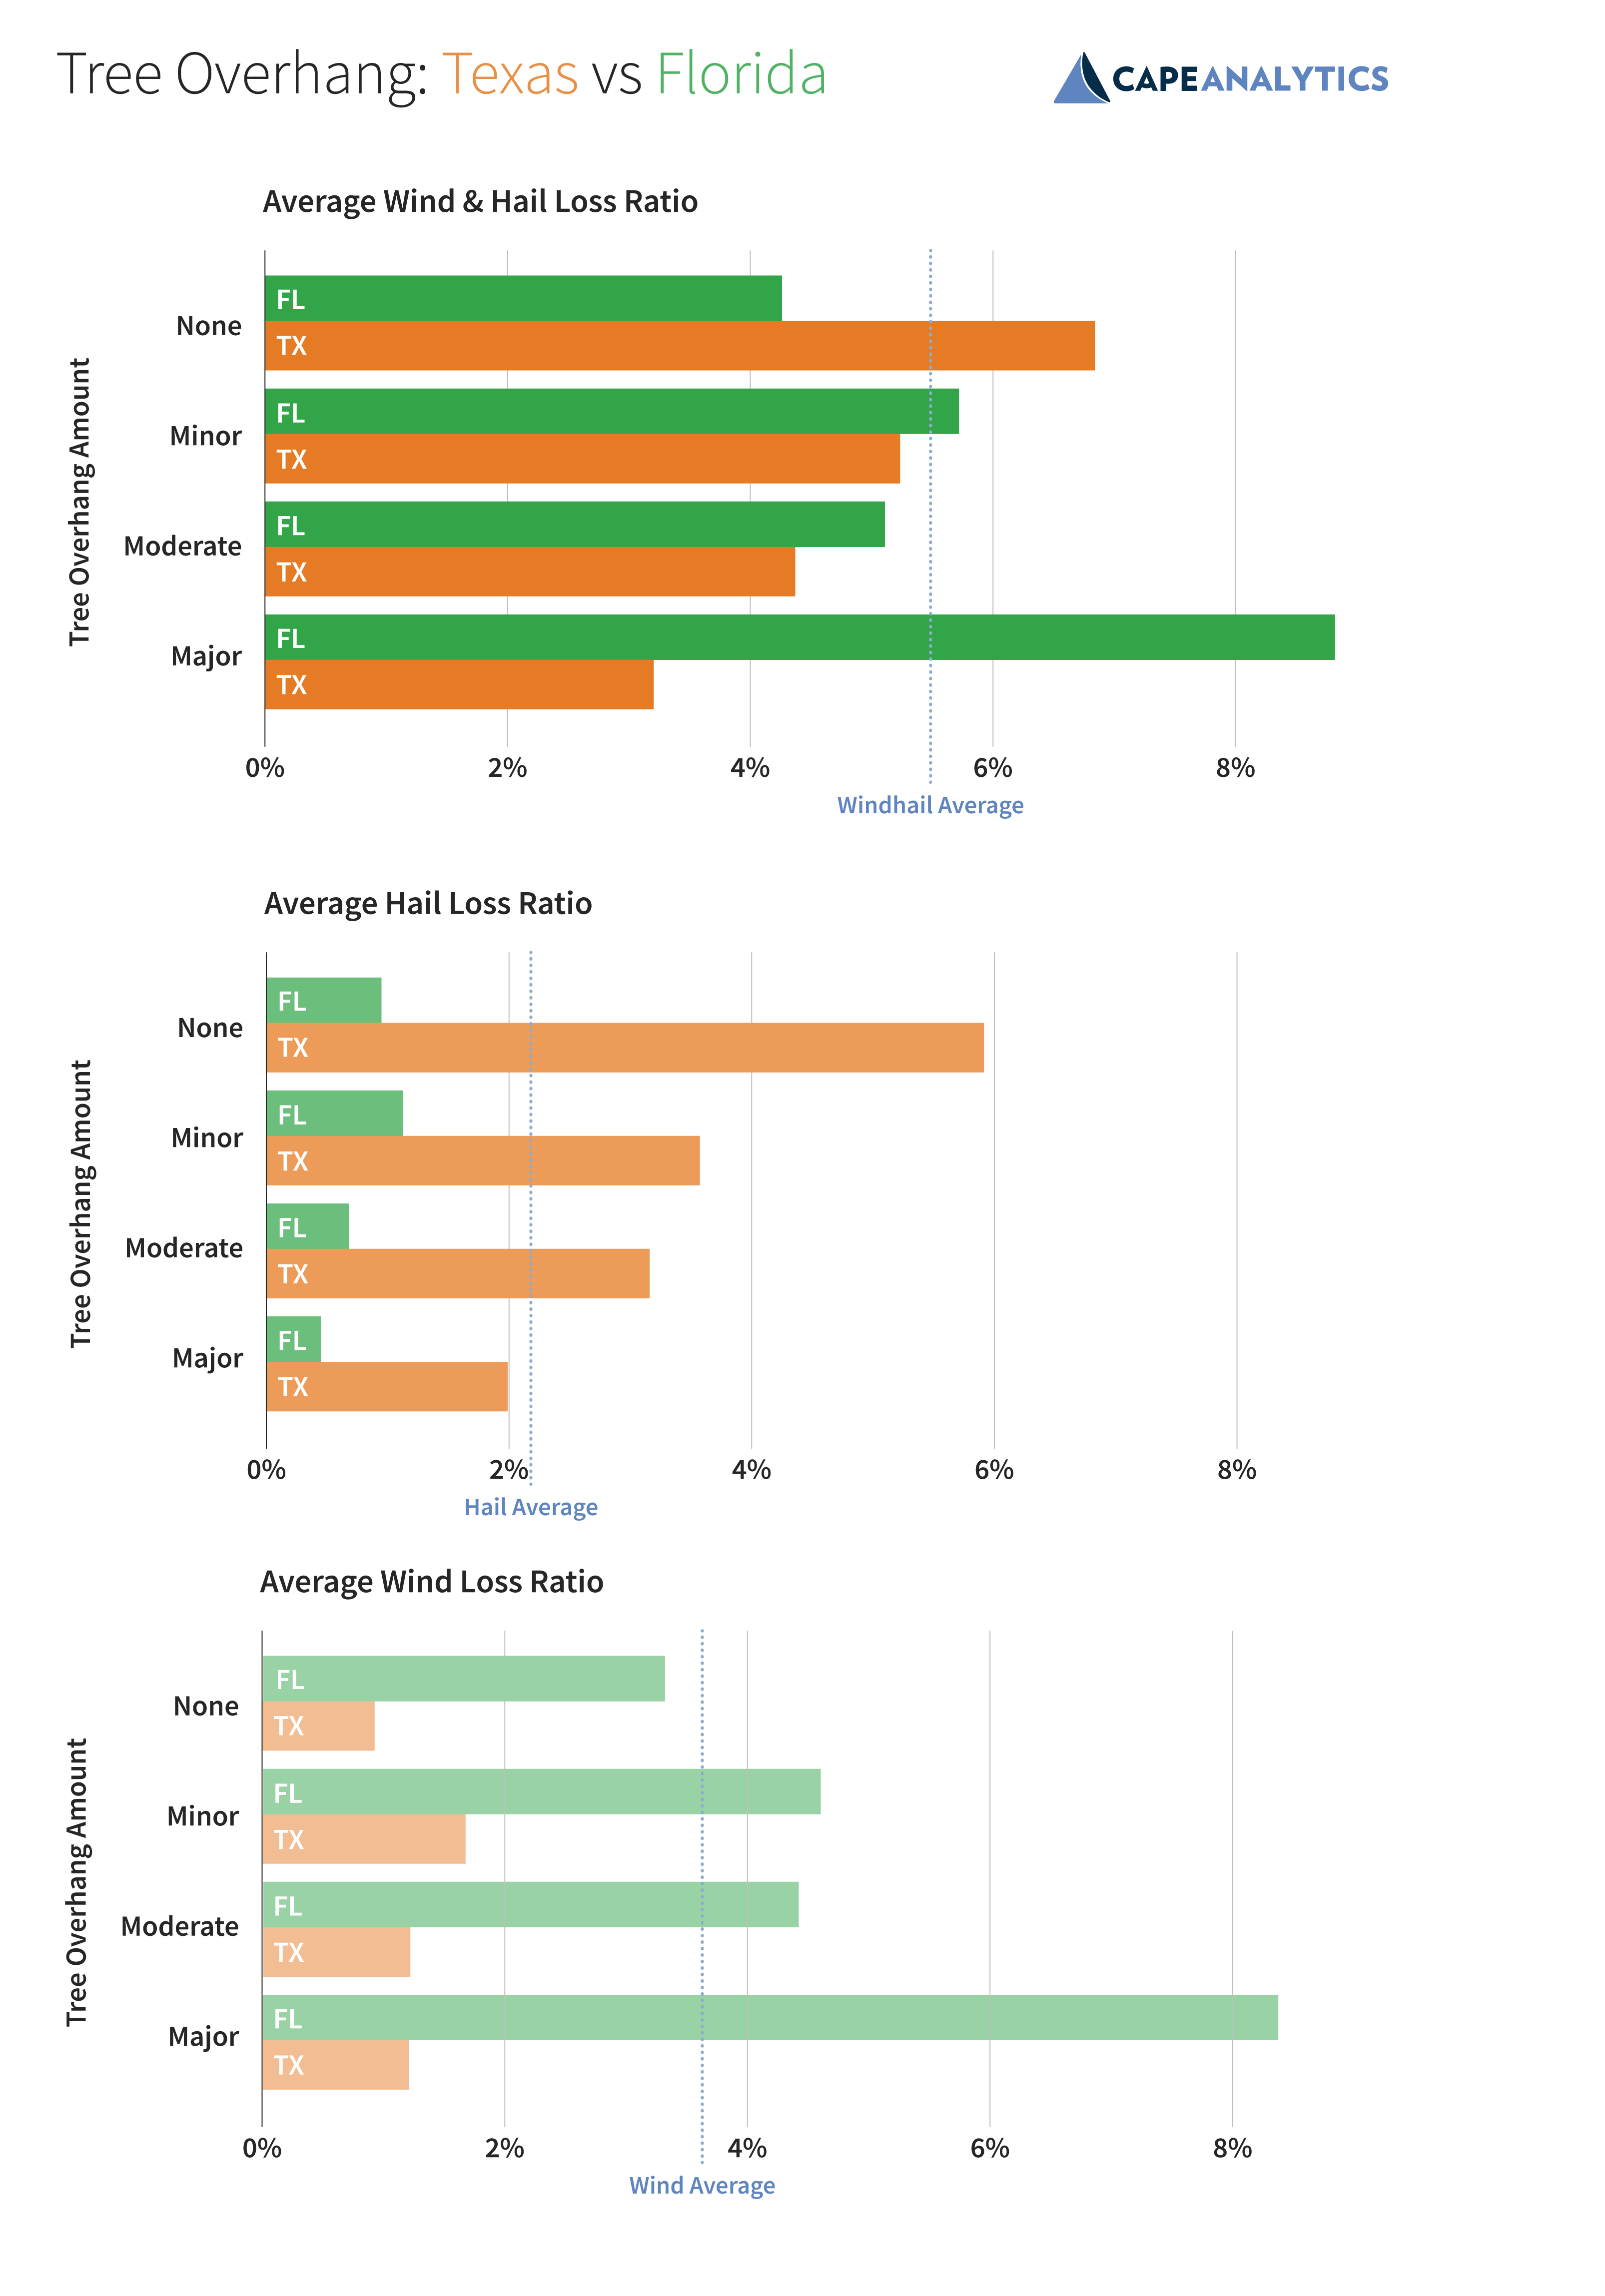
When looking at the effect of tree overhang in a wind-prone state like Florida, the signal is much clearer, with fewer trees leading to lower losses. However, in hail-prone regions like Texas, tree overhang shows a clear inverse signal. It’s possible that trees protect the roof from additional damage in hail-prone states and offset the additional wind vulnerability created by a large degree of tree overhang.
Understanding hail vulnerability requires triangulating multiple inputs
As we seek a better understanding of hail risk, a few concepts stand out. First, roof complexity should be taken into account by carriers when assessing hail vulnerability. Second, for the most granular segmentation of hail vulnerability multiple inputs must be considered—there is no one (or two) sole driver(s) that can be a full proxy to risk as may be the case in other perils.
Given the expanding footprint of hail risk, it is critical for insurers to gather as much accurate and actionable data and insights as possible to improve their underwriting and pricing in this space.
At CAPE, we believe our suite of attributes that are predictive of hail vulnerability can provide carriers with what’s needed to improve their decision-making and close the hail knowledge gap. Looking forward, our team will continue to share additional insights and capabilities specific to hail.
Interested in learning more about our peril solutions, roof insights, or predictive hail property attributes from CAPE? Contact us today.
Aggregate Statistics Created Using Data Produced from Nearmap Imagery