Reinsurance Case Study: AXA XL
A complete and up-to-date understanding of the risk exposure of a cedant portfolio is important for both reinsurers and primary carriers to adequately price and negotiate catastrophe risk.
Lower frequency of hurricane landfall in the last 10 years, combined with lack of available data has led many reinsurers to leave out fundamental risk factors in their analysis of cedant portfolios.
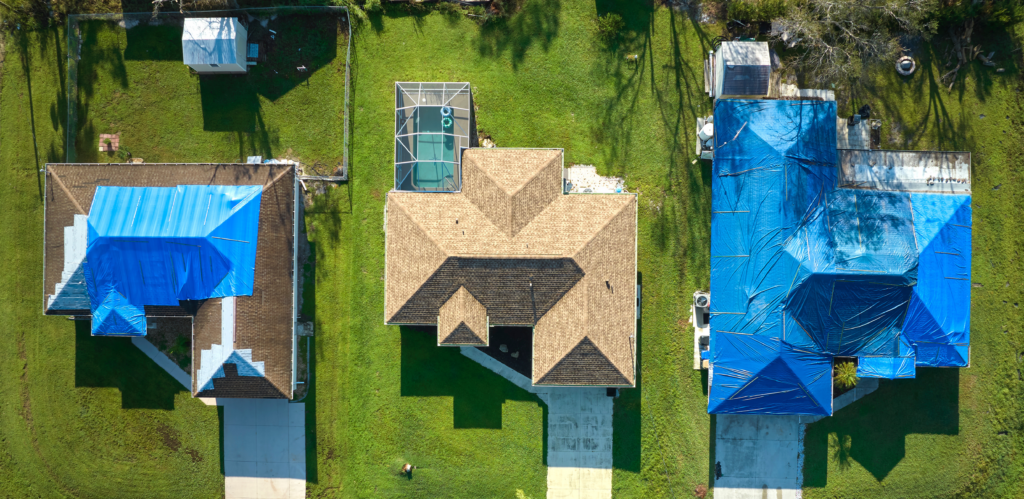
One of these risk factors is the presence of pool enclosures. After the 2004/2005 storms, catastrophe modeling firm AIR Worldwide found the average insurance claim per unit of exposure was reported to be as great as 35% higher for homes with pool enclosures. With CAPE Analytics, reinsurers can benefit by accessing up-to-date secondary modifier inputs, like presence of a pool enclosure.

The Situation
AXA XL wanted to mitigate risks by better understanding cedant data quality, place a stronger emphasis on catastrophe risk management at the point ofunderwriting
and empower their cedants with objective, property-specific insights.
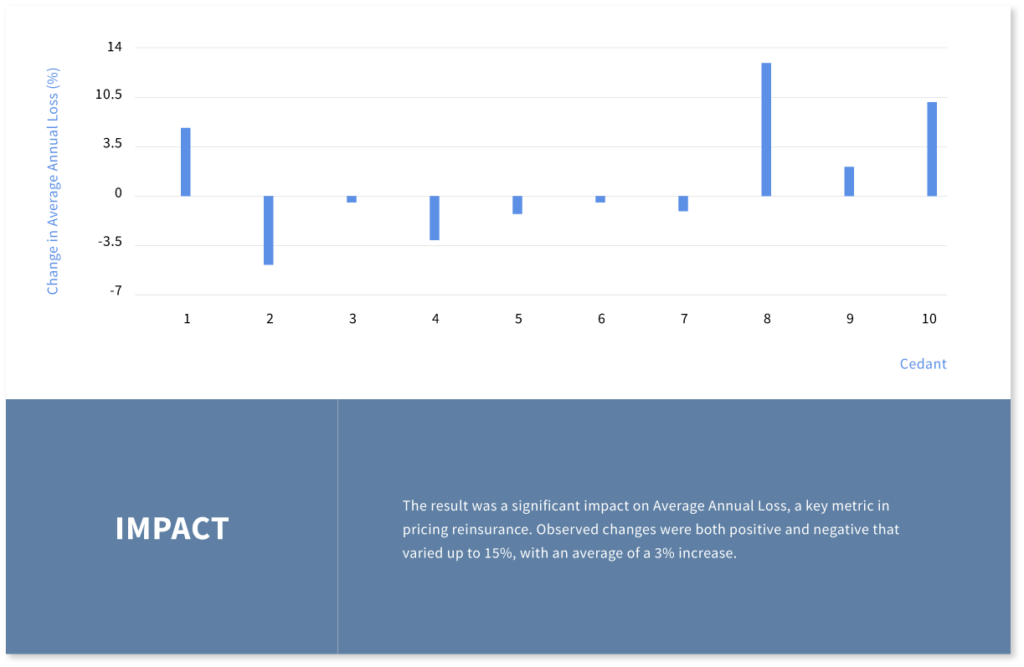
To demonstrate the impact, the team did an initial test to verify and quantify the impact of CAPE Analytics’ reinsurance solution.
What They Did
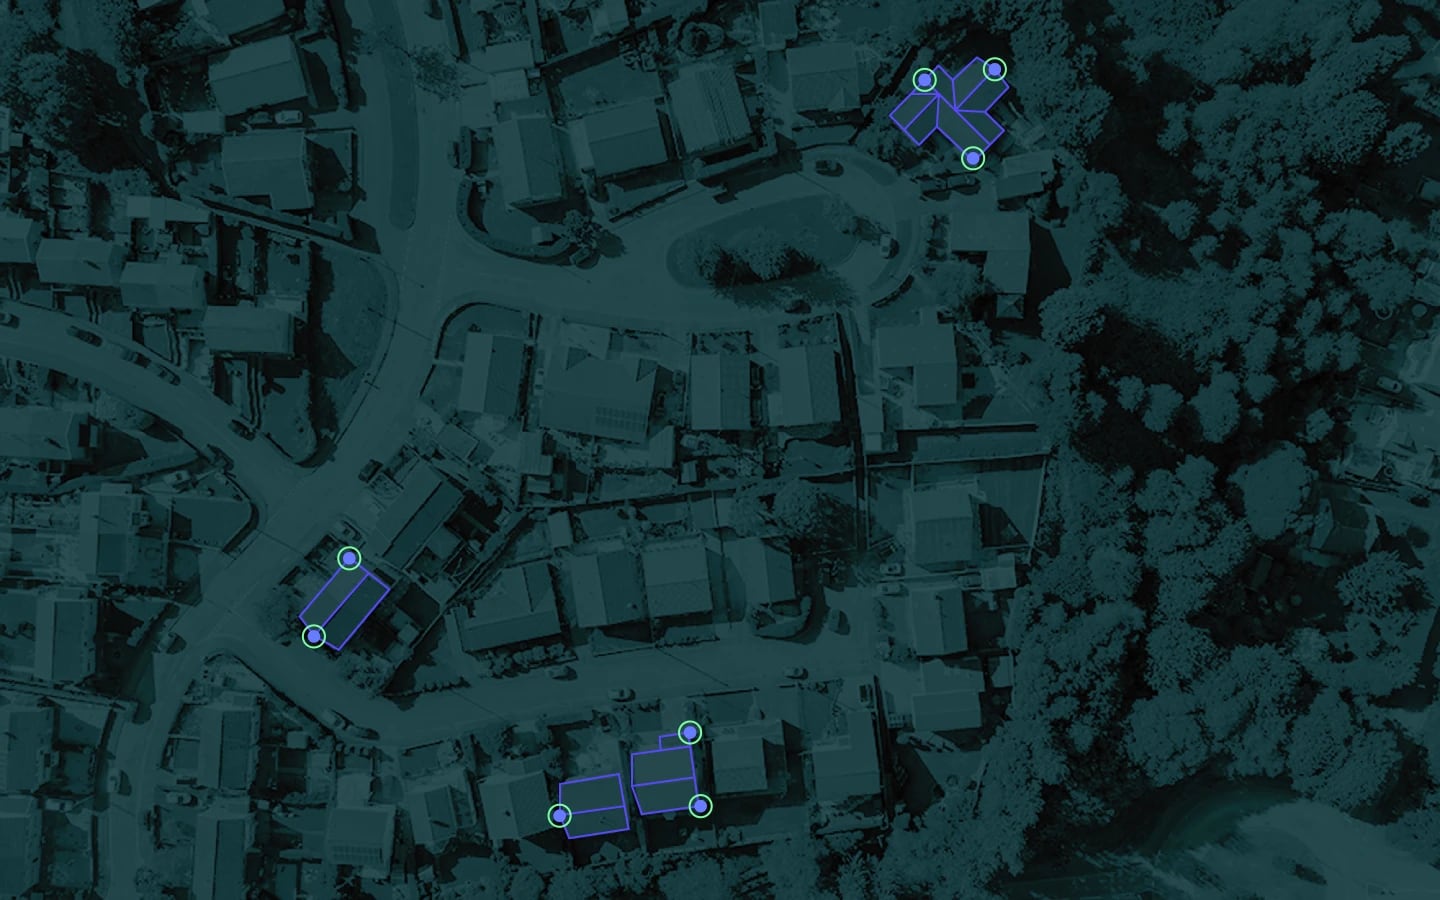
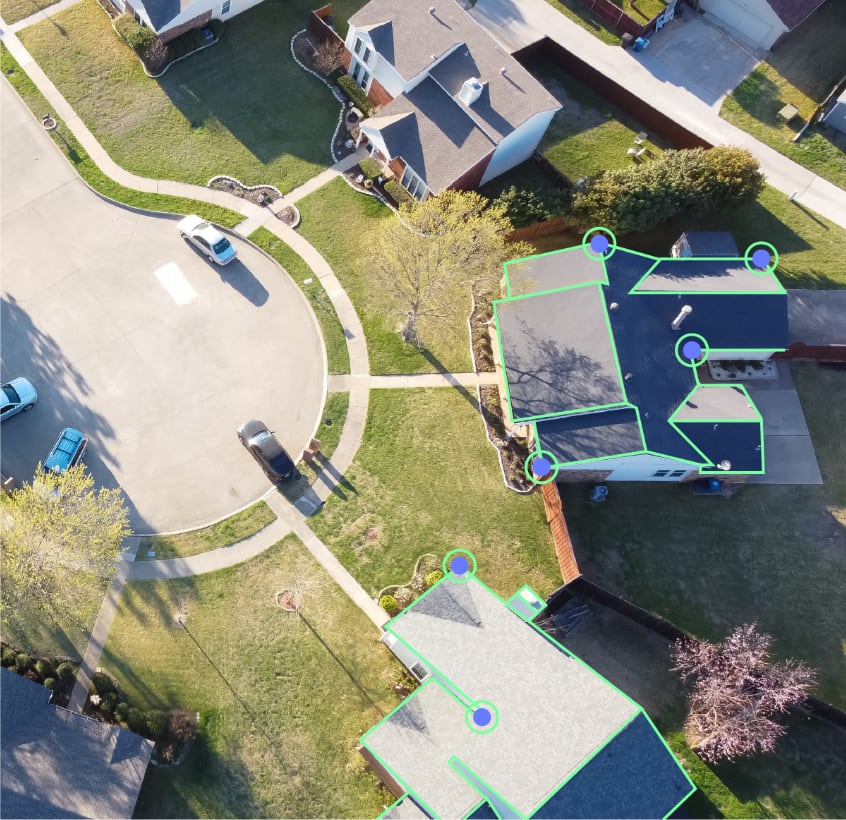
AXA XL performed the evaluation with two different, known secondary modifier attributes to verify and quantify magnitude of data improvements—the roof geometry and the presence of a pool enclosure.
They evaluated the difference in Average Annual Loss (using a top model vendor) for ten cedant portfolios, before and after using CAPE Analytics.
CAPE Analytics provides us with unique, deep, and accurate property insights at both the individual address and portfolio level that improve our ability to better underwrite our client portfolios. This, in turn, allows us to better serve our customers while being compatible with our current workflow.
Charles Cooper
Chief Executive of Reinsurance at AXA XL
Catastrophe models utilized without secondary characteristics output AAL assuming industry-weighted averages of secondary modifier presence. For example, a roof geometry distribution that assumes 65% gable roofs, 25% hip, and 10% flat for a particular occupancy (e.g. residential homes) and region (i.e. Florida).
However, losses for portfolio analyses that incorporate secondary characteristics will reflect the actual prevalence of those attributes. As secondary modifiers can sway individual property losses from just a few percent to potentially doubling losses, portfolio-level loss could be impacted significantly with small change in prevalence. By utilizing property attributes delivered at scale by CAPE across nearly all exposures within a cedant portfolio, a reinsurer can produce the most accurate and lowest uncertainty model results to support their pricing workflows.