Cape Analytics Data Report: The Most Solar Places in America
An Overview of Solar Power Growth

After many decades of false starts, renewable energy is poised to one day challenge fossil fuels as the energy source of choice in America. As an example, in 2018, 17.1% of electricity in the United States was generated from renewable sources. While solar energy made up just 1.59% of electricity produced in 2018, it was still an increase of 20.5% over the prior year.
While solar may be becoming more popular in the United States, its popularity is not recognized everywhere. One common thread, however, is that people choose to go solar for various reasons; some choose for financial reasons, others for purely environmental. Locations where it’s sunny year-round also play a factor, while in other places the weather makes solar panels less viable.
Cape Analytics’ AI Approach to Solar Analysis
At Cape Analytics, we use AI to analyze huge quantities of geospatial data to help insurers and other companies better understand properties. By leveraging computer vision to parse aerial imagery, we can understand critical property information, such as the kind of roof a house has, whether a property has cleared vegetation around the house to guard against wildfires, or whether there are solar panels on the roof.
To that end, we wanted to better understand solar panel use in America and categorize “the most solar” places in the U.S. To accomplish this, we used AI to scan 38 million properties in 21 major metropolitan areas across the United States. Here’s a snapshot of what we learned:
- Among major metro areas, San Diego is the most solar city and Detroit was the least.
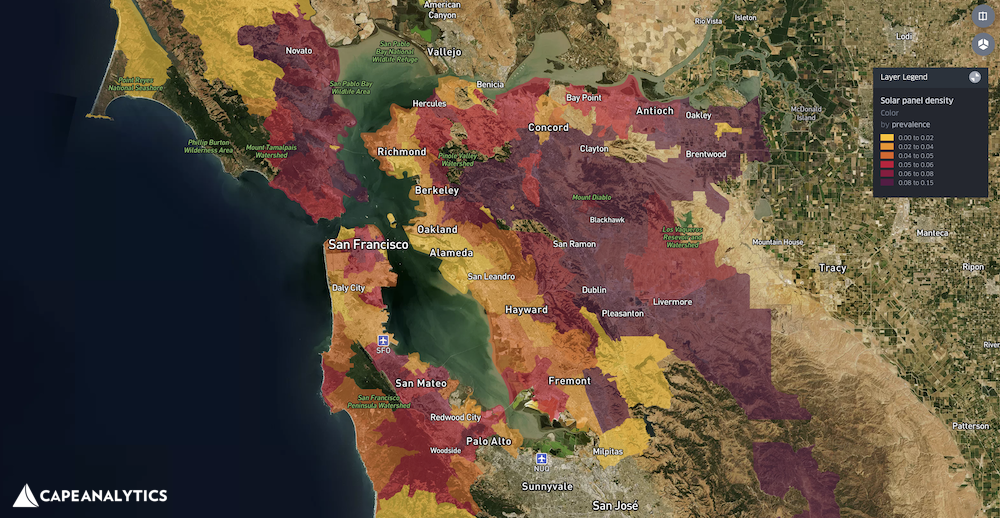
- According to our data, Brentwood, California is the most solar place in America.
- At the neighborhood level, more than 30% of the homes in La Costa Ridge in Carlsbad, California, have solar panels, making it the most solar neighborhood in the country.
An Analysis of Solar Homes Per Capita Across the United States
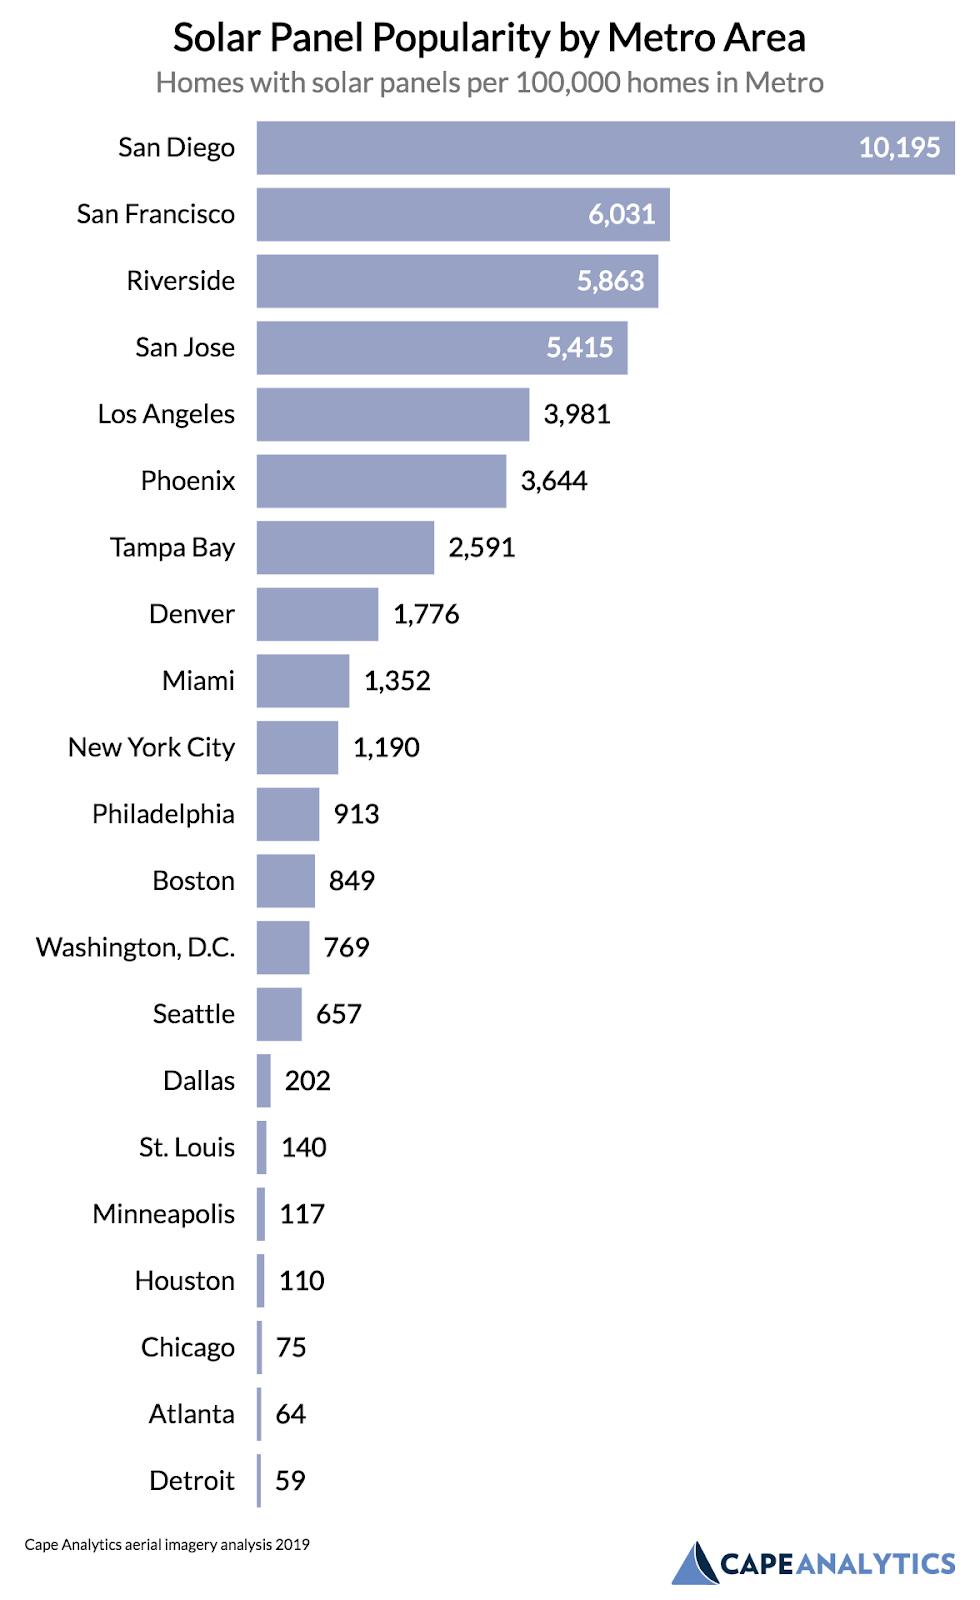
Of the 38 million homes we analyzed across the United States, 1.8% of them had solar panels. On a per-capita basis in the 21 metropolitan areas we examined, that came out to 1,837 solar homes per 100,000 homes. Some areas, however, have substantially higher (or lower) rates of solar panel adoption. The chart below shows the per capita solar homes split out by metropolitan area:

By a considerable margin, the San Diego metropolitan area leads the pack when it comes to solar penetration. For every 100,000 houses, 10,195 of them have solar panels—a rate of more than 10%. Rounding out the top 5 are San Francisco, Riverside, San Jose, and Los Angeles, all of which are located in California.
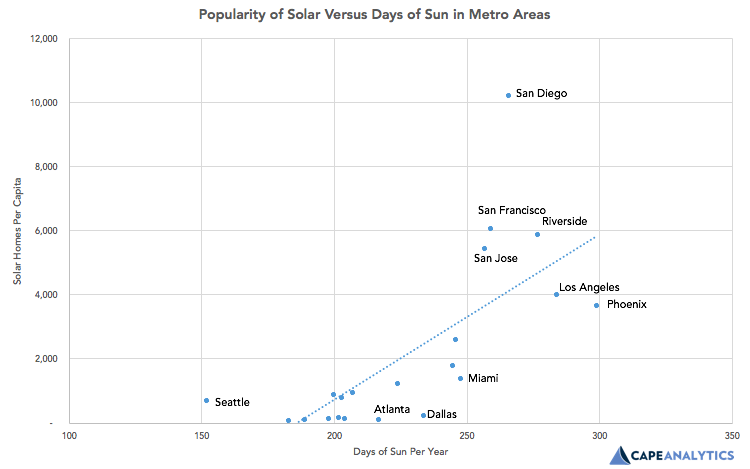
Why do so many homes in California have solar? Part of the reason is that the temperate climate provides year-round sun—obviously a critical factor for solar power. The chart below compares the number of days of sun per year versus the per capita number of solar homes.

As you would expect, the more sunny days, the more solar homes you find. Some places, however, have about the same level of sun, but drastically different solar penetration. Locations that land above the line on the chart, such as San Diego, have more solar homes than you’d expect, whereas ones landing below the line, such as Atlanta, have fewer than you’d expect. Of all the places we studied, Phoenix has the most sunny days of the year, yet only about a third of the panel-equipped homes as San Diego. Atlanta and Dallas have decent weather, but a minimal number of solar homes.
Much of the solar penetration correlates to sunshine, but this doesn’t completely explain why comparably sunny places have very different levels of solar adoption. A huge driver of solar panels adoption is income, with wealthier homeowners being far more likely to go solar. This dynamic also helps explain why wealthy California areas top the most-solar list.
Another factor to consider is that some states and local municipalities offer additional financial incentives—beyond the federal tax incentive—for installing solar panels. Some states like Arizona offer an additional tax credit. Others like California have incentives based on the energy the panels produce. Still others like Texas have no statewide solar incentives, though some local municipalities have their own.
According to our analysis of geospatial data, 1.8% of homes in the metropolitan areas we studied have solar panels. Despite there being an ample amount of sun in places like Texas, Arizona, and Georgia, it’s California that dominates when it comes to adoption. Nearly all solar cities in America are located in the Golden State, despite it not being much sunnier than other places in America. When it comes to solar, it’s environmentalism, incentives, and income level that drive adoption.
These insights were created using imagery provided by Nearmap.
