Responding to the Alarm Bell: Enabling a Better Understanding of Defensible Space and Wildfire Risk for Individual Structures
Cape Analytics offers defensible space analytics with unprecedented granularity
By Kevin Van Leer, Client Solutions Manager
Major wildfire events over the past few years, from Alberta, Canada in May 2016 to the devastation in Paradise, California in November 2018, have left the insurance industry and homeowners searching for new solutions to understand and mitigate their wildfire risk.
Historically, industry scoring tools have been used over the last two decades by underwriters to quantify the general level of wildfire risk for a given property. These are now being updated using new information gleaned from these latest fires, in the hopes of better modeling overall wildfire risk. However, as part of these efforts, there has been little done to gather higher-resolution insight into wildfire risk using new technologies.
In an article for Insurance Journal, I wrote about the opportunities and challenges artificial intelligence and computer vision present for more granular underwriting across the wildland-urban interface. In particular, I referenced the call to action from the California Department of Insurance (CDI) for the insurance industry to leverage imagery that is “granular enough to objectively identify fuel sources and other physical characteristics” and that “takes into account mitigation done by the homeowner or the community.”
Now, with Cape Analytics’ defensible space Firescape solution, the industry has a market-leading vulnerability dataset that can meaningfully impact wildfire underwriting and rating workflows.
Wildfire is one of the most granular perils in terms of how risk can deviate from one property to another. The insurance industry has spent most of its resources delivering underwriting-focused tools that overlay contextual information related to wildfire, such as terrain, climate, and fuels, onto the geographic location of a property. Well established solutions, such as Verisk’s FireLine® or the publicly-available USDA Wildland Fire Hazard Potential maps, in addition to newer entrants like RedZone, deliver valuable scores that help carriers identify the general wildfire risk for a given property. For example, RedZone’s RZRisk, according to their website, describes whether a property is located in an area at risk of wildfire, embers, smoke, or evacuation, in addition to a Fire Frequency score.
However, a major issue with these scoring tools is that their resolution is typically at a resolution larger than an individual home. Today, if an underwriter wants to differentiate between properties located in the same wildfire risk zone, they have no way to do so outside of a physical inspection.
For example, the below image shows properties impacted by the 2018 Carr Fire in Redding, CA that would have an identical wildfire risk score, but varying levels of defensible space.
How can these properties be differentiated today for risk selection and pricing? To do so, the insurance industry needs more than another wildfire risk score.
In a typical workflow, an underwriter receives a regional wildfire hazard zone score for a property, which helps them determine eligibility, rate, or whether an inspection is needed. In most cases, properties that are located in moderate to high-risk regions will result in an inspection, either virtual or on-site, to determine if the property has made efforts toward mitigating its wildfire risk through defensible space and fire-resistant construction measures. Inspections add extra time and resources to the underwriting process, presenting an opportunity to optimize this workflow through automation.
Cape’s Firescape solution enables carriers to access data at the property level for important wildfire attributes like distance to vegetation and surrounding fuel load. By plugging this data into an automated rules-based workflow—along with additional roof attributes like covering material—carriers can automate their underwriting process for a large proportion of the properties they would typically inspect. For example, a carrier could define an underwriting rule to automatically approve policies without human review for any mid to low-value property with acceptable defensible space and fire-resistant roof construction (both of which are instantly supplied by Cape). Conversely, another rule could trigger an inspection or suggest mitigation action for properties that have poor defensible space and that are located in a high wildfire risk region (based on a traditional scoring tool). Both rules can be instantiated at time of quote or renewal, resulting in significant gains in underwriting efficiency.
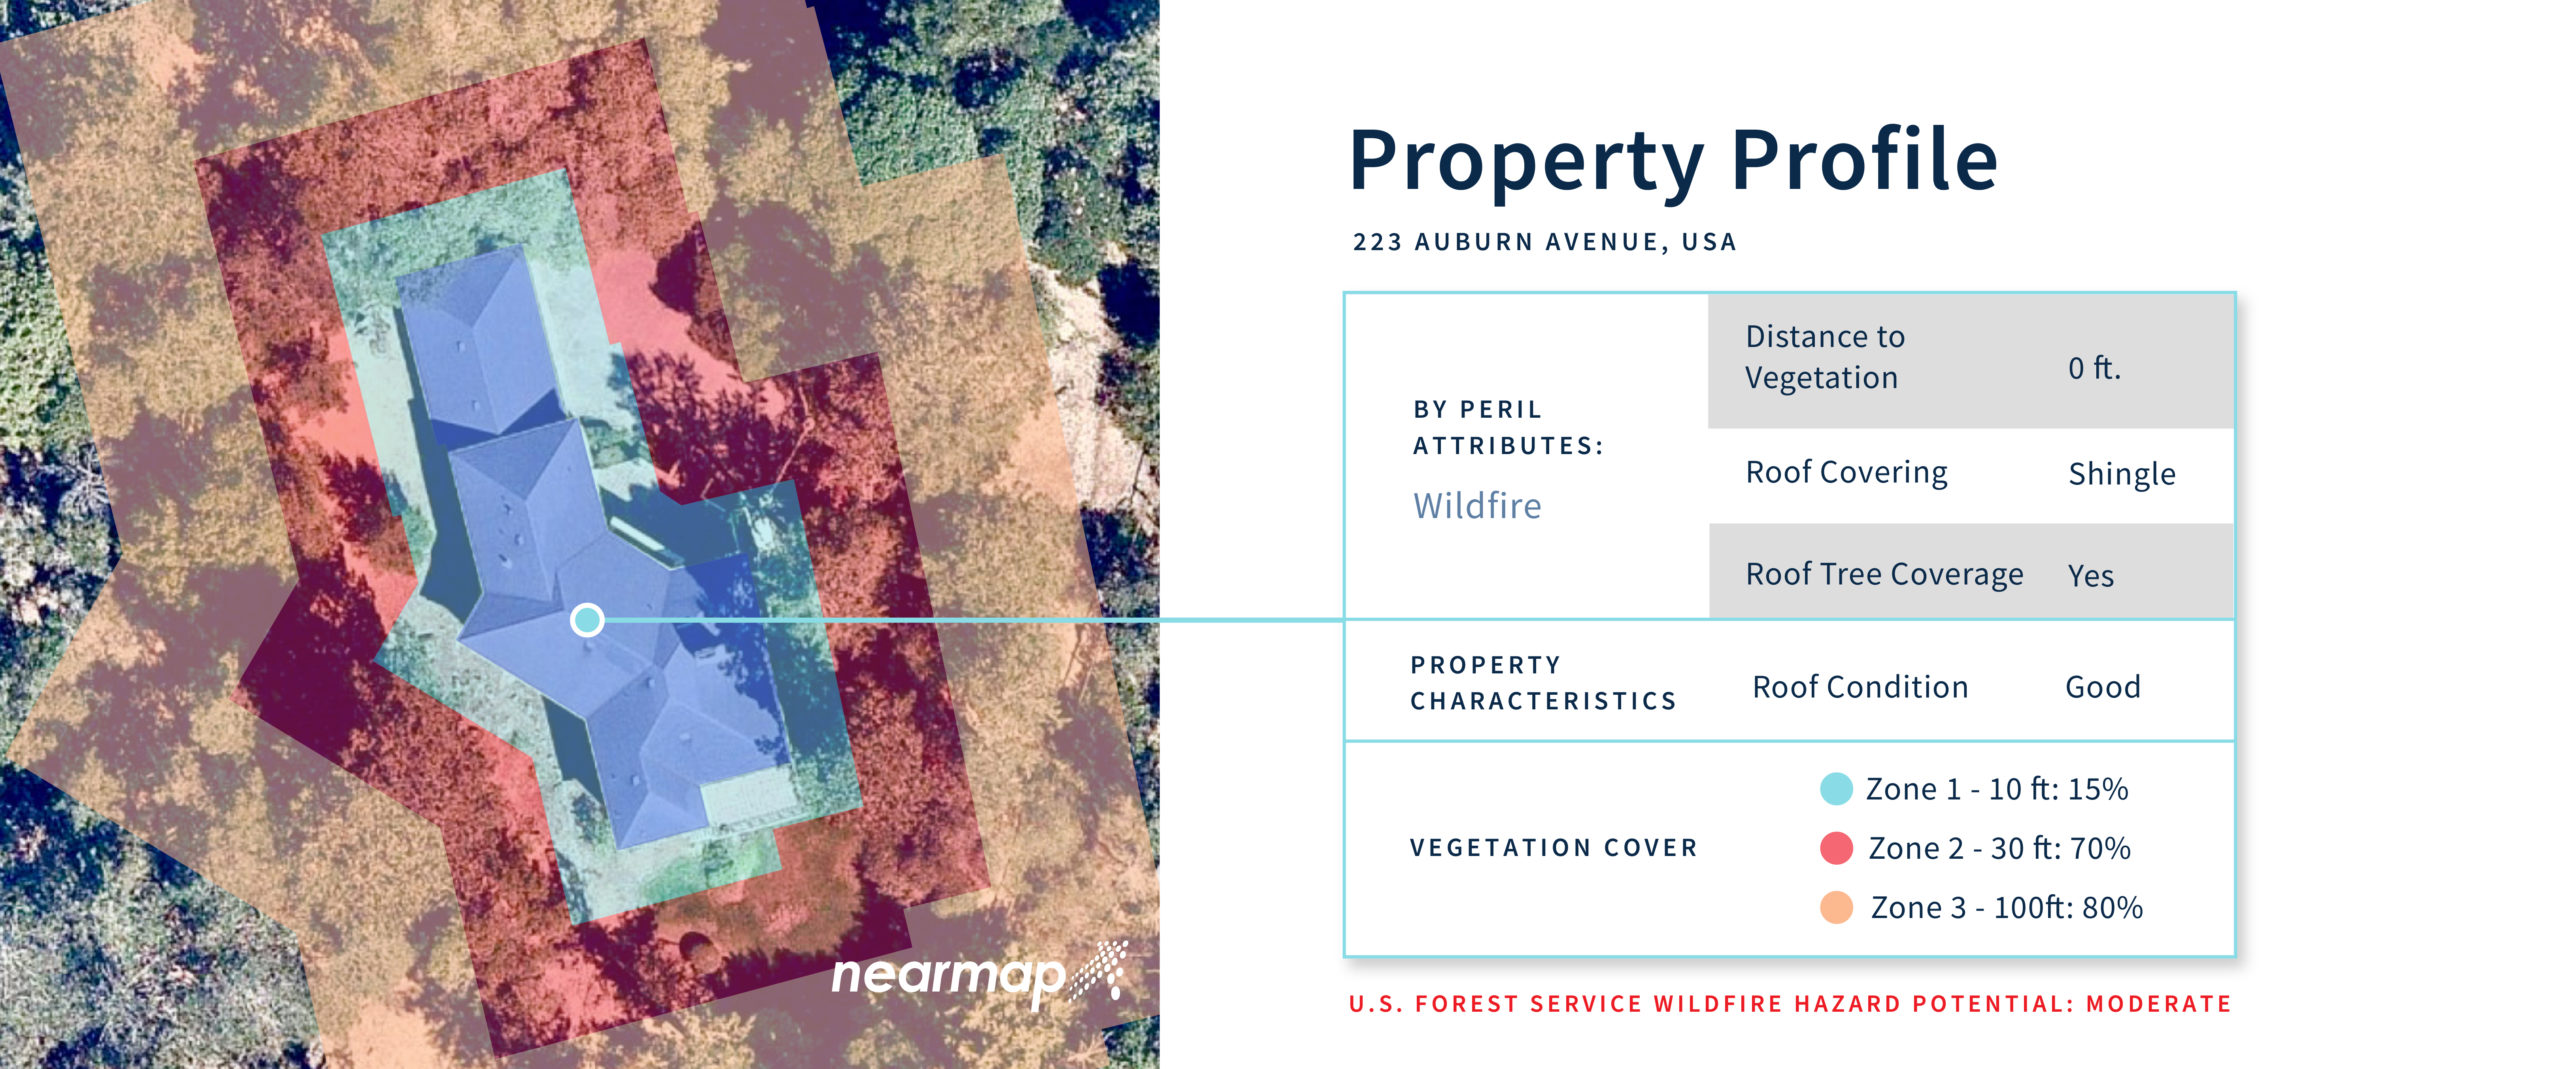
An example of Cape Analytics’ defensible space information
Today, individual insurance carriers or entities like CAL FIRE do not have the resources to inspect every property and enforce wildfire mitigation measures like brush cutback and the use of fire-resistant construction materials. At Cape Analytics, we see this as the first step in generating granular, property specific data that can help underwriters, fire safety officials, and hazard score providers make more accurate assessments on a home-by-home basis. We believe this can help insurers and homeowners better protect themselves from structure- and life-threatening wildfires.